
Managed Service Operations Partner for Law Firms

P360 runs your firm's operations as one team, marketing, trust accounting, staffing, and the AI-assisted technology that ties them together. We help firms convert more leads and give attorneys more time to focus on legal work.
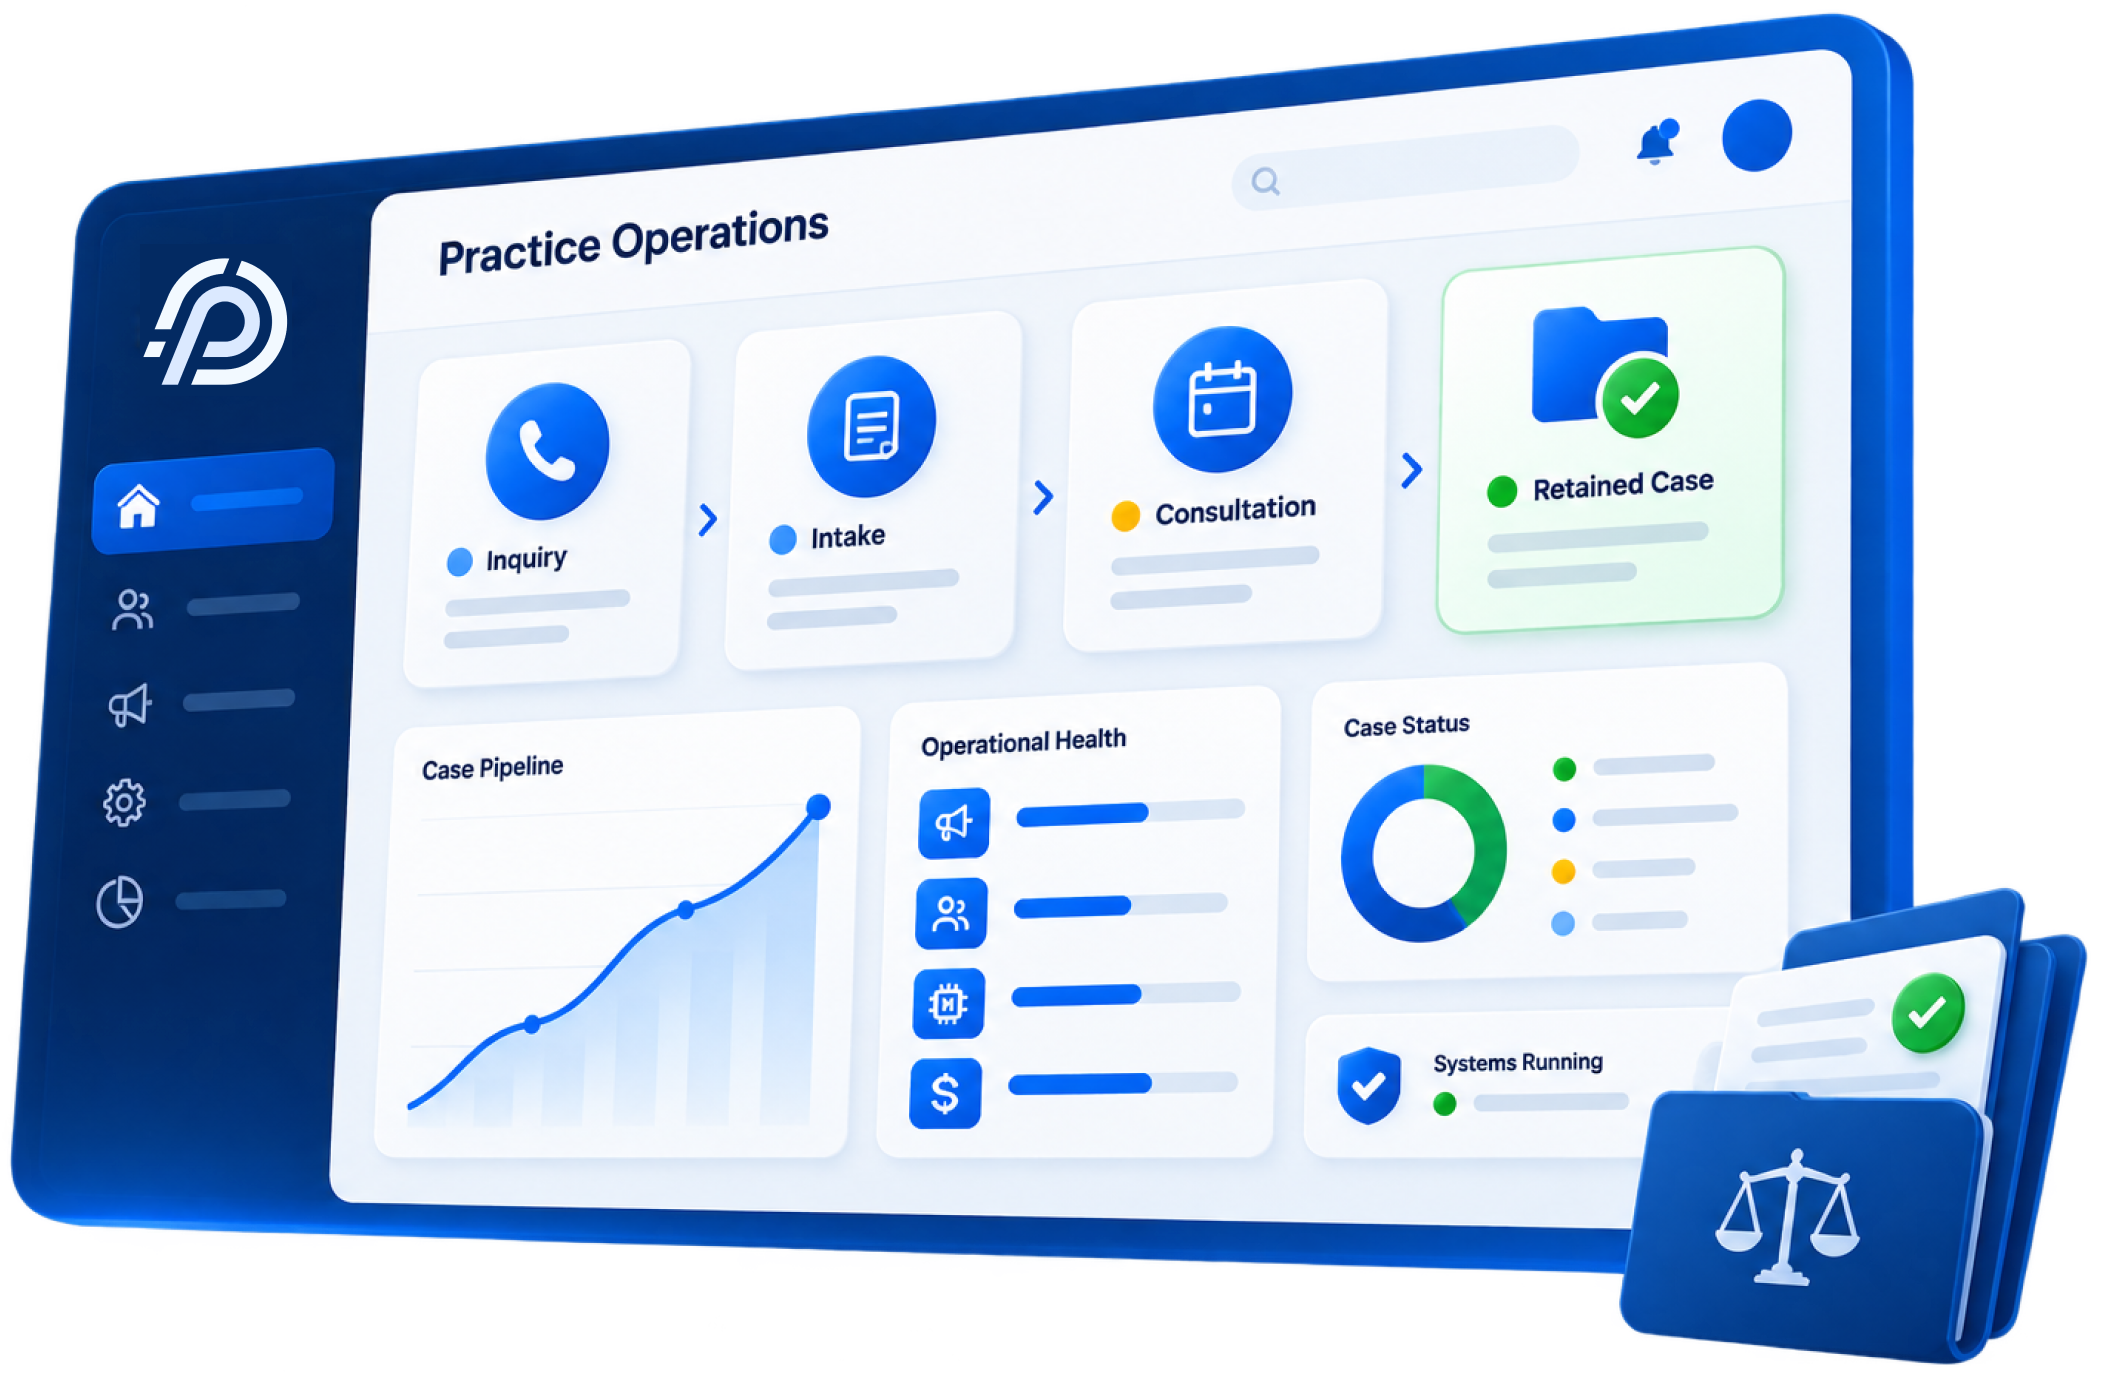
Dashboard screen labeled Practice Operations showing a flow from Inquiry, Intake, Consultation, to Retained Case with icons, a graph titled Case Pipeline with an upward trend, Operational Health metrics with progress bars, a Case Status pie chart, and a Systems Running status. Blue sidebar features icons for home, users, announcements, settings, and analytics. A folder icon with scales of justice is in front of the screen.

The Law Firm Operating Challenge

Most firms run on four disconnected vendors:

  • Blue and white megaphone icon with a user symbol and a plus sign, indicating adding a person to an announcement or promotion.
    Marketing Agency

    Generates leads without visibility into which ones become retained clients.

  • Blue-themed illustration showing a computer monitor with a list on the screen, a cloud with upload and download arrows in front, and a large gear in the background, symbolizing IT services or cloud computing.
    IT Provider

    Maintains systems without owning how well they support intake and legal work.

  • Icon of a document showing a pie chart, bullet points, and a bar graph with a dollar symbol coin overlapping the bottom right corner, representing financial data or report.
    Finance Team

    Tracks financial performance without visibility into the operations driving it.

  • Icon of three outlined person figures with a blue plus symbol overlay indicating add or new user.
    Staffing Company

    Increases capacity without managing people, processes, and technology.

Four contracts. Four points of contact. No one owns the full process when leads go cold or intake falls behind. Firms don't need another vendor, they need one team that owns the whole intake-to-retention pipeline and answers for the result.

How P360 Runs a Firm's Operations

Practice 360 manages the business functions behind your firm through coordinated teams, systems, and reporting that support the client journey from first inquiry to retained case.

Lead Generation

Case inquiries go to the firm that shows up first. P360 manages the ad spend and targeting that gets your firm found before competitors.
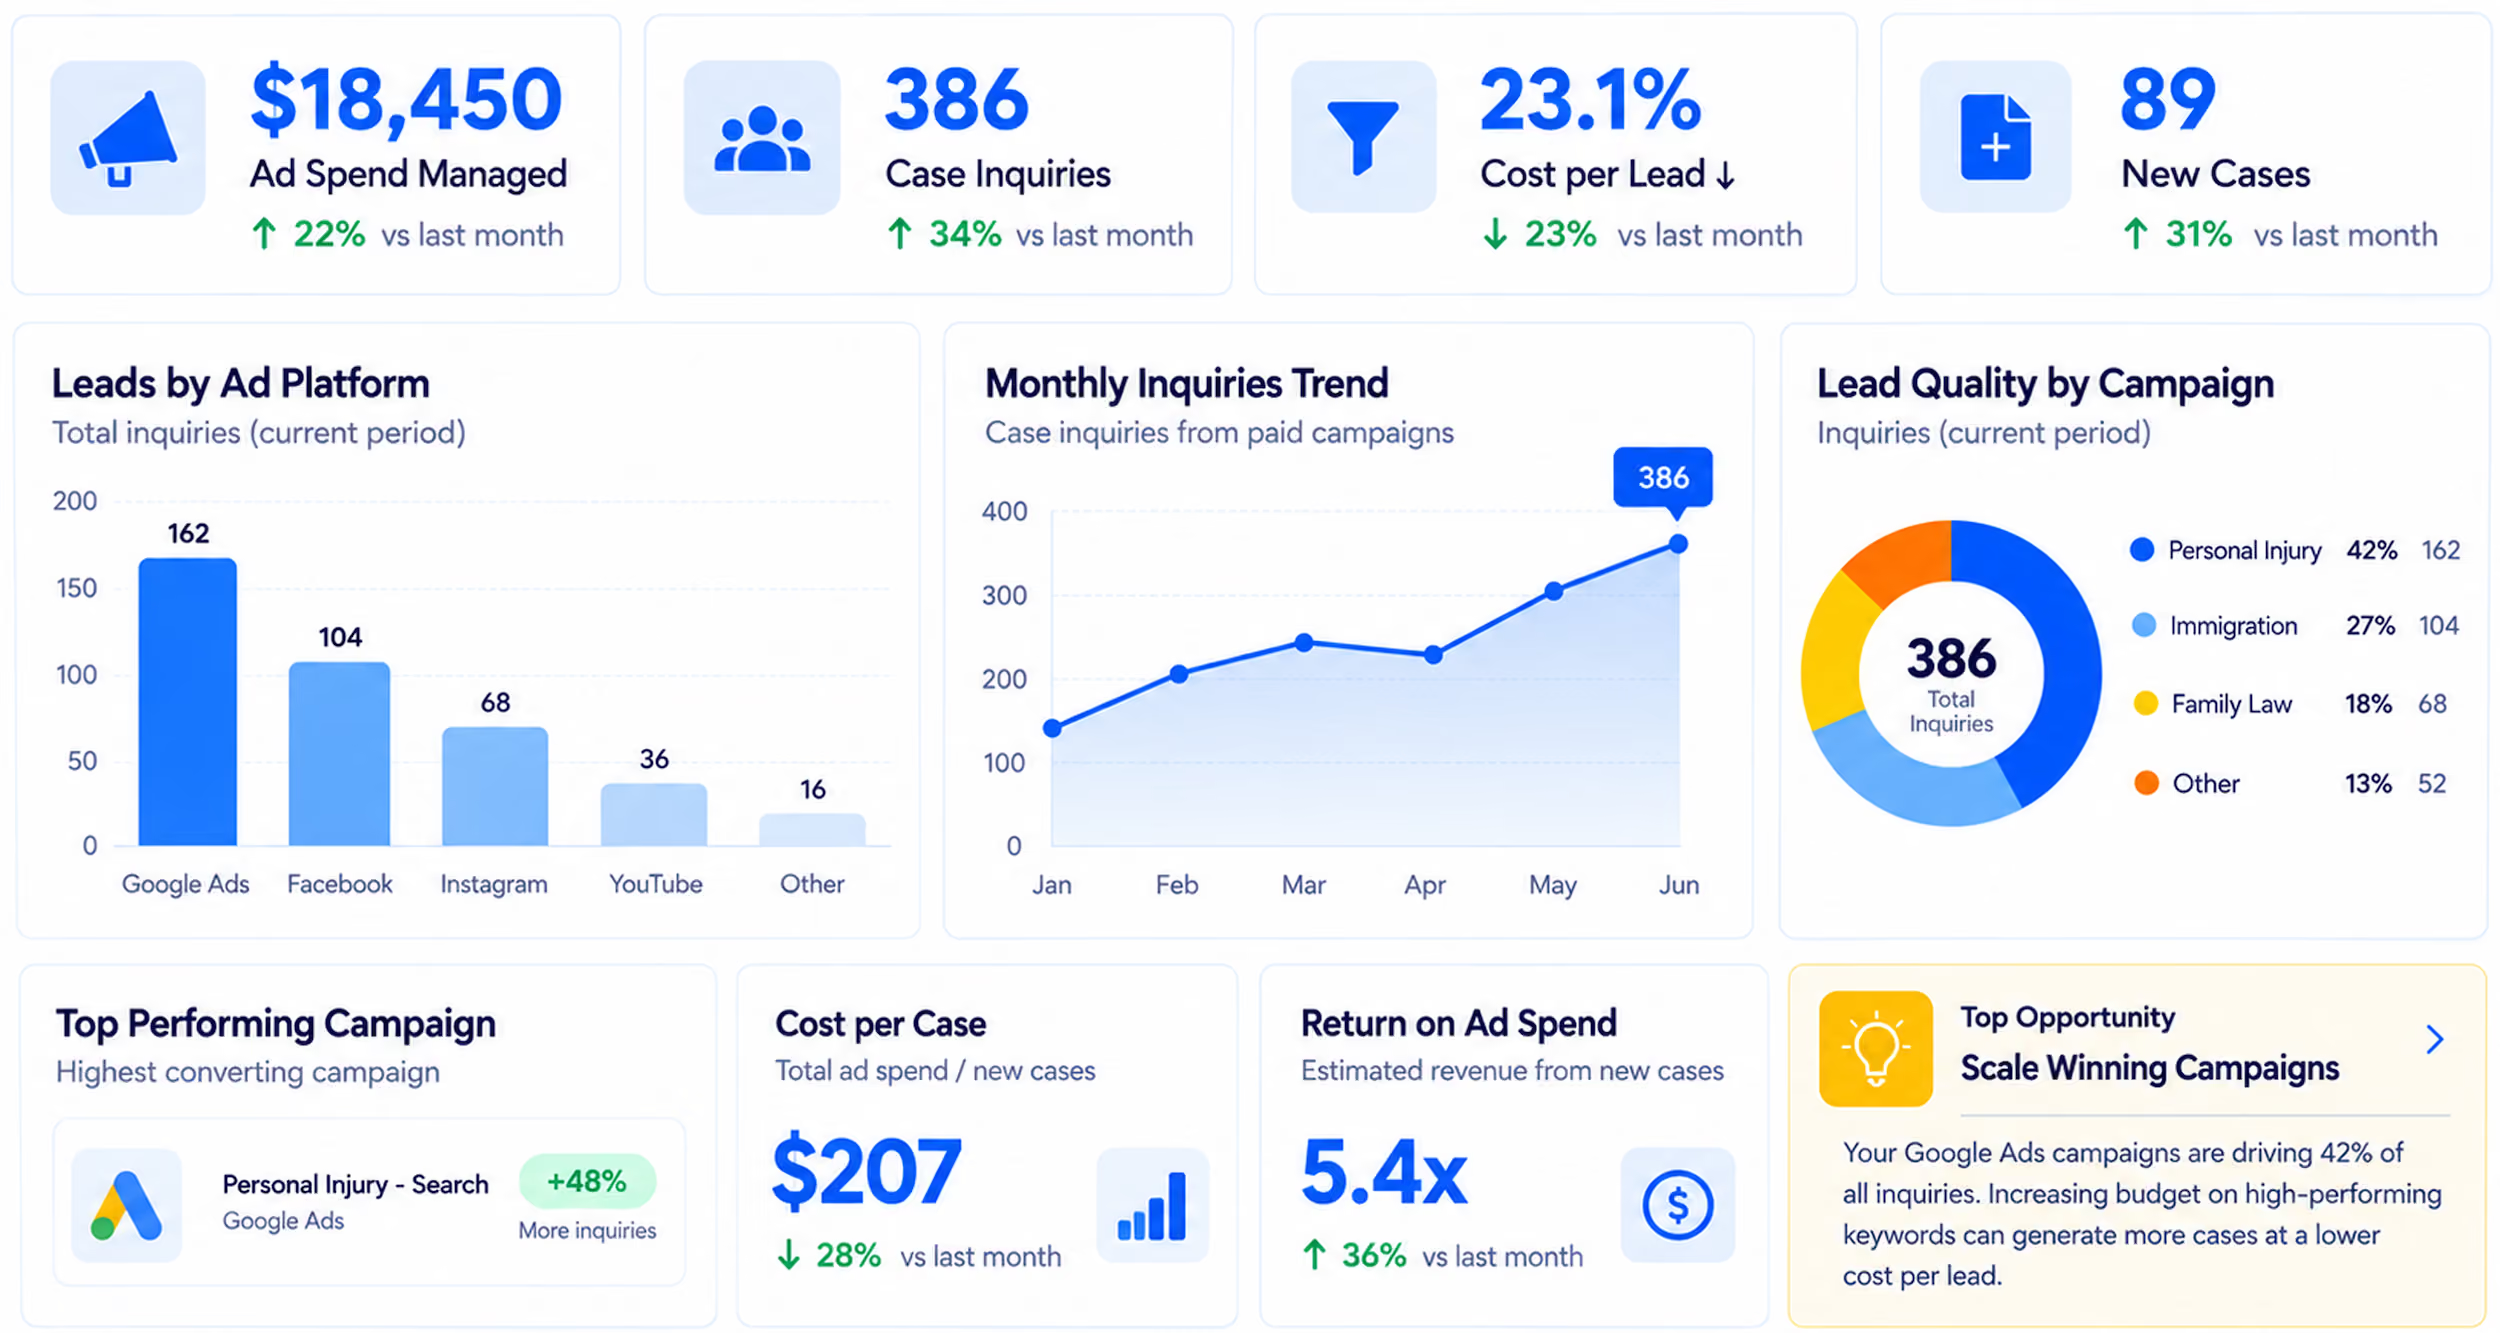
Digital marketing dashboard showing ad spend of $18,450 with 22% increase, 386 case inquiries up 34%, 23.1% cost per lead reduced by 23%, and 89 new cases up 31%. Bar chart of leads by ad platform shows Google Ads leading with 162 inquiries, followed by Facebook, Instagram, YouTube, and other. Line graph shows monthly inquiries trend rising to 386 in June. Pie chart of lead quality by campaign shows personal injury 42%, immigration 27%, family law 18%, and other 13%. Top campaign is Personal Injury - Search with 48% increase. Cost per case is $207, down 28%, and return on ad spend is 5.4x, up 36%. Top opportunity highlights scaling winning campaigns by focusing on high-performing Google Ads keywords.

Managed IT Services

A single system outage can stall active cases. P360 keeps your systems secure and running, so no time is lost to downtime.
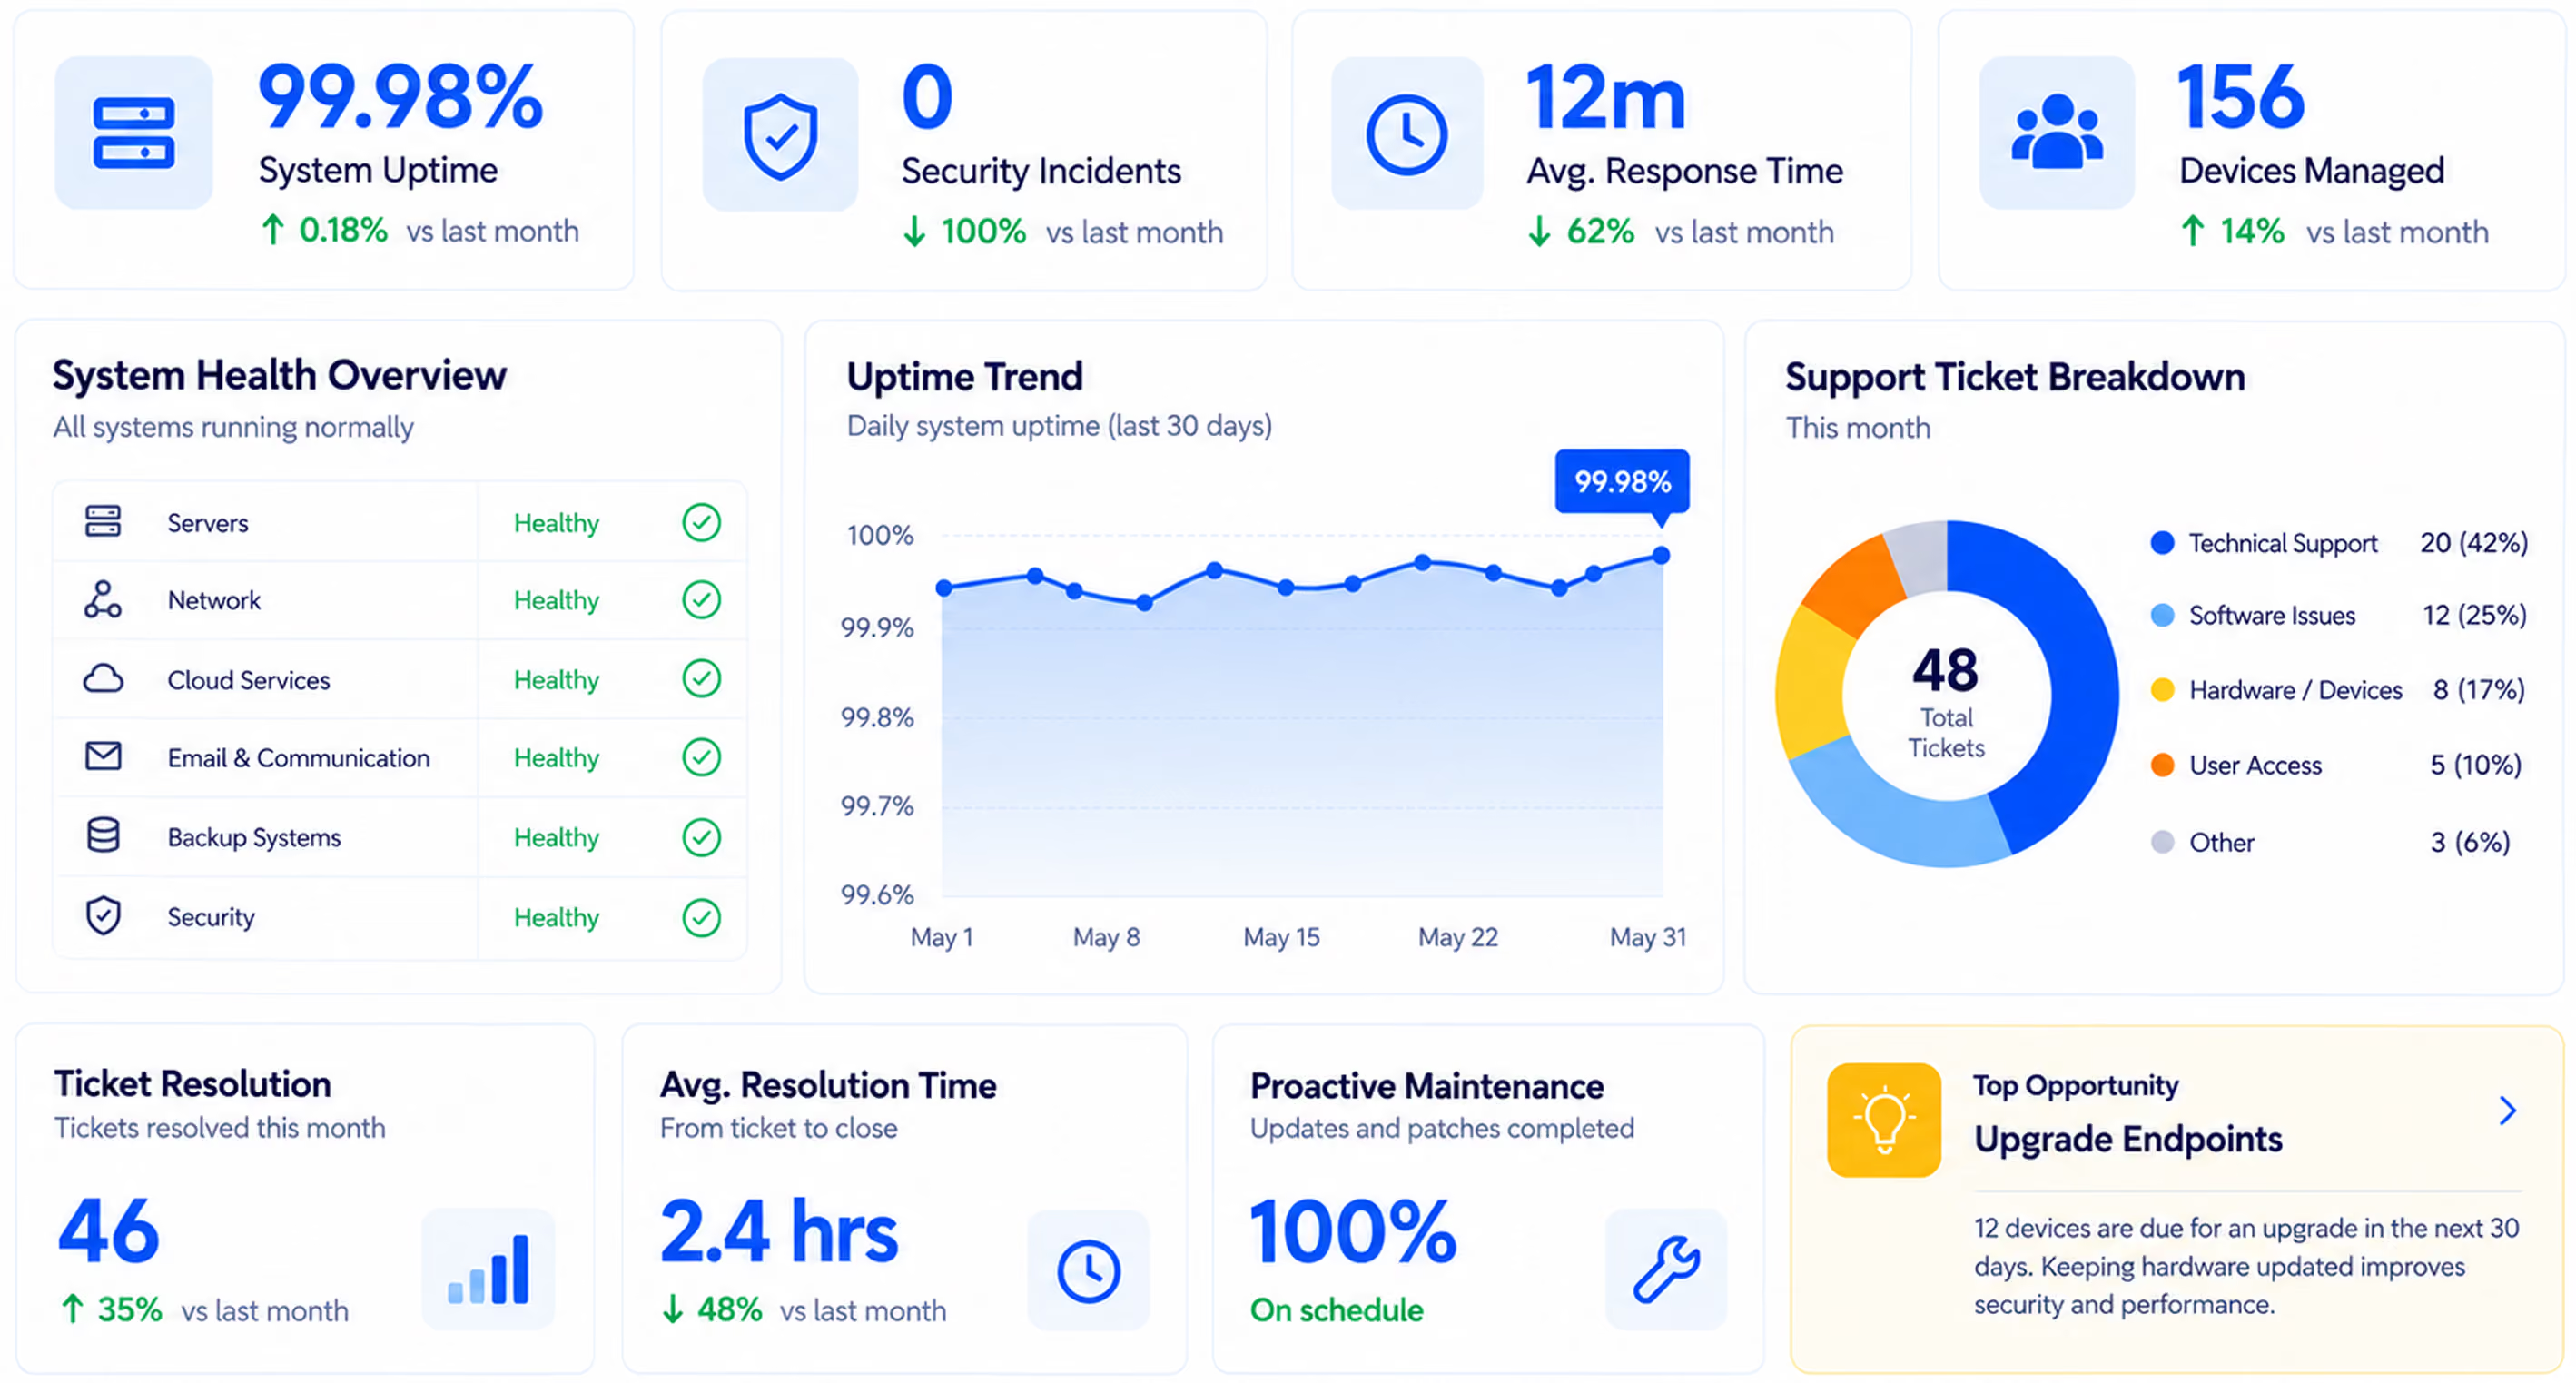
Dashboard showing IT system metrics including 99.98% system uptime with a 0.18% increase, zero security incidents with 100% decrease, 12-minute average response time improving by 62%, and 156 devices managed up 14%. System health overview indicates all systems including servers, network, cloud services, email, backup, and security are healthy. Uptime trend graph displays stable daily uptime near 99.98% for May. Support ticket breakdown pie chart shows 48 total tickets this month: 42% technical support, 25% software issues, 17% hardware/devices, 10% user access, 6% other. Additional stats show 46 tickets resolved this month up 35%, average resolution time 2.4 hours improving by 48%, and 100% proactive maintenance on schedule. A top opportunity recommends upgrading 12 endpoints in next 30 days to improve security and performance.

AI Services

Slow responses lose cases to firms that answer faster. P360 uses AI to qualify and respond to leads in seconds, day or night.
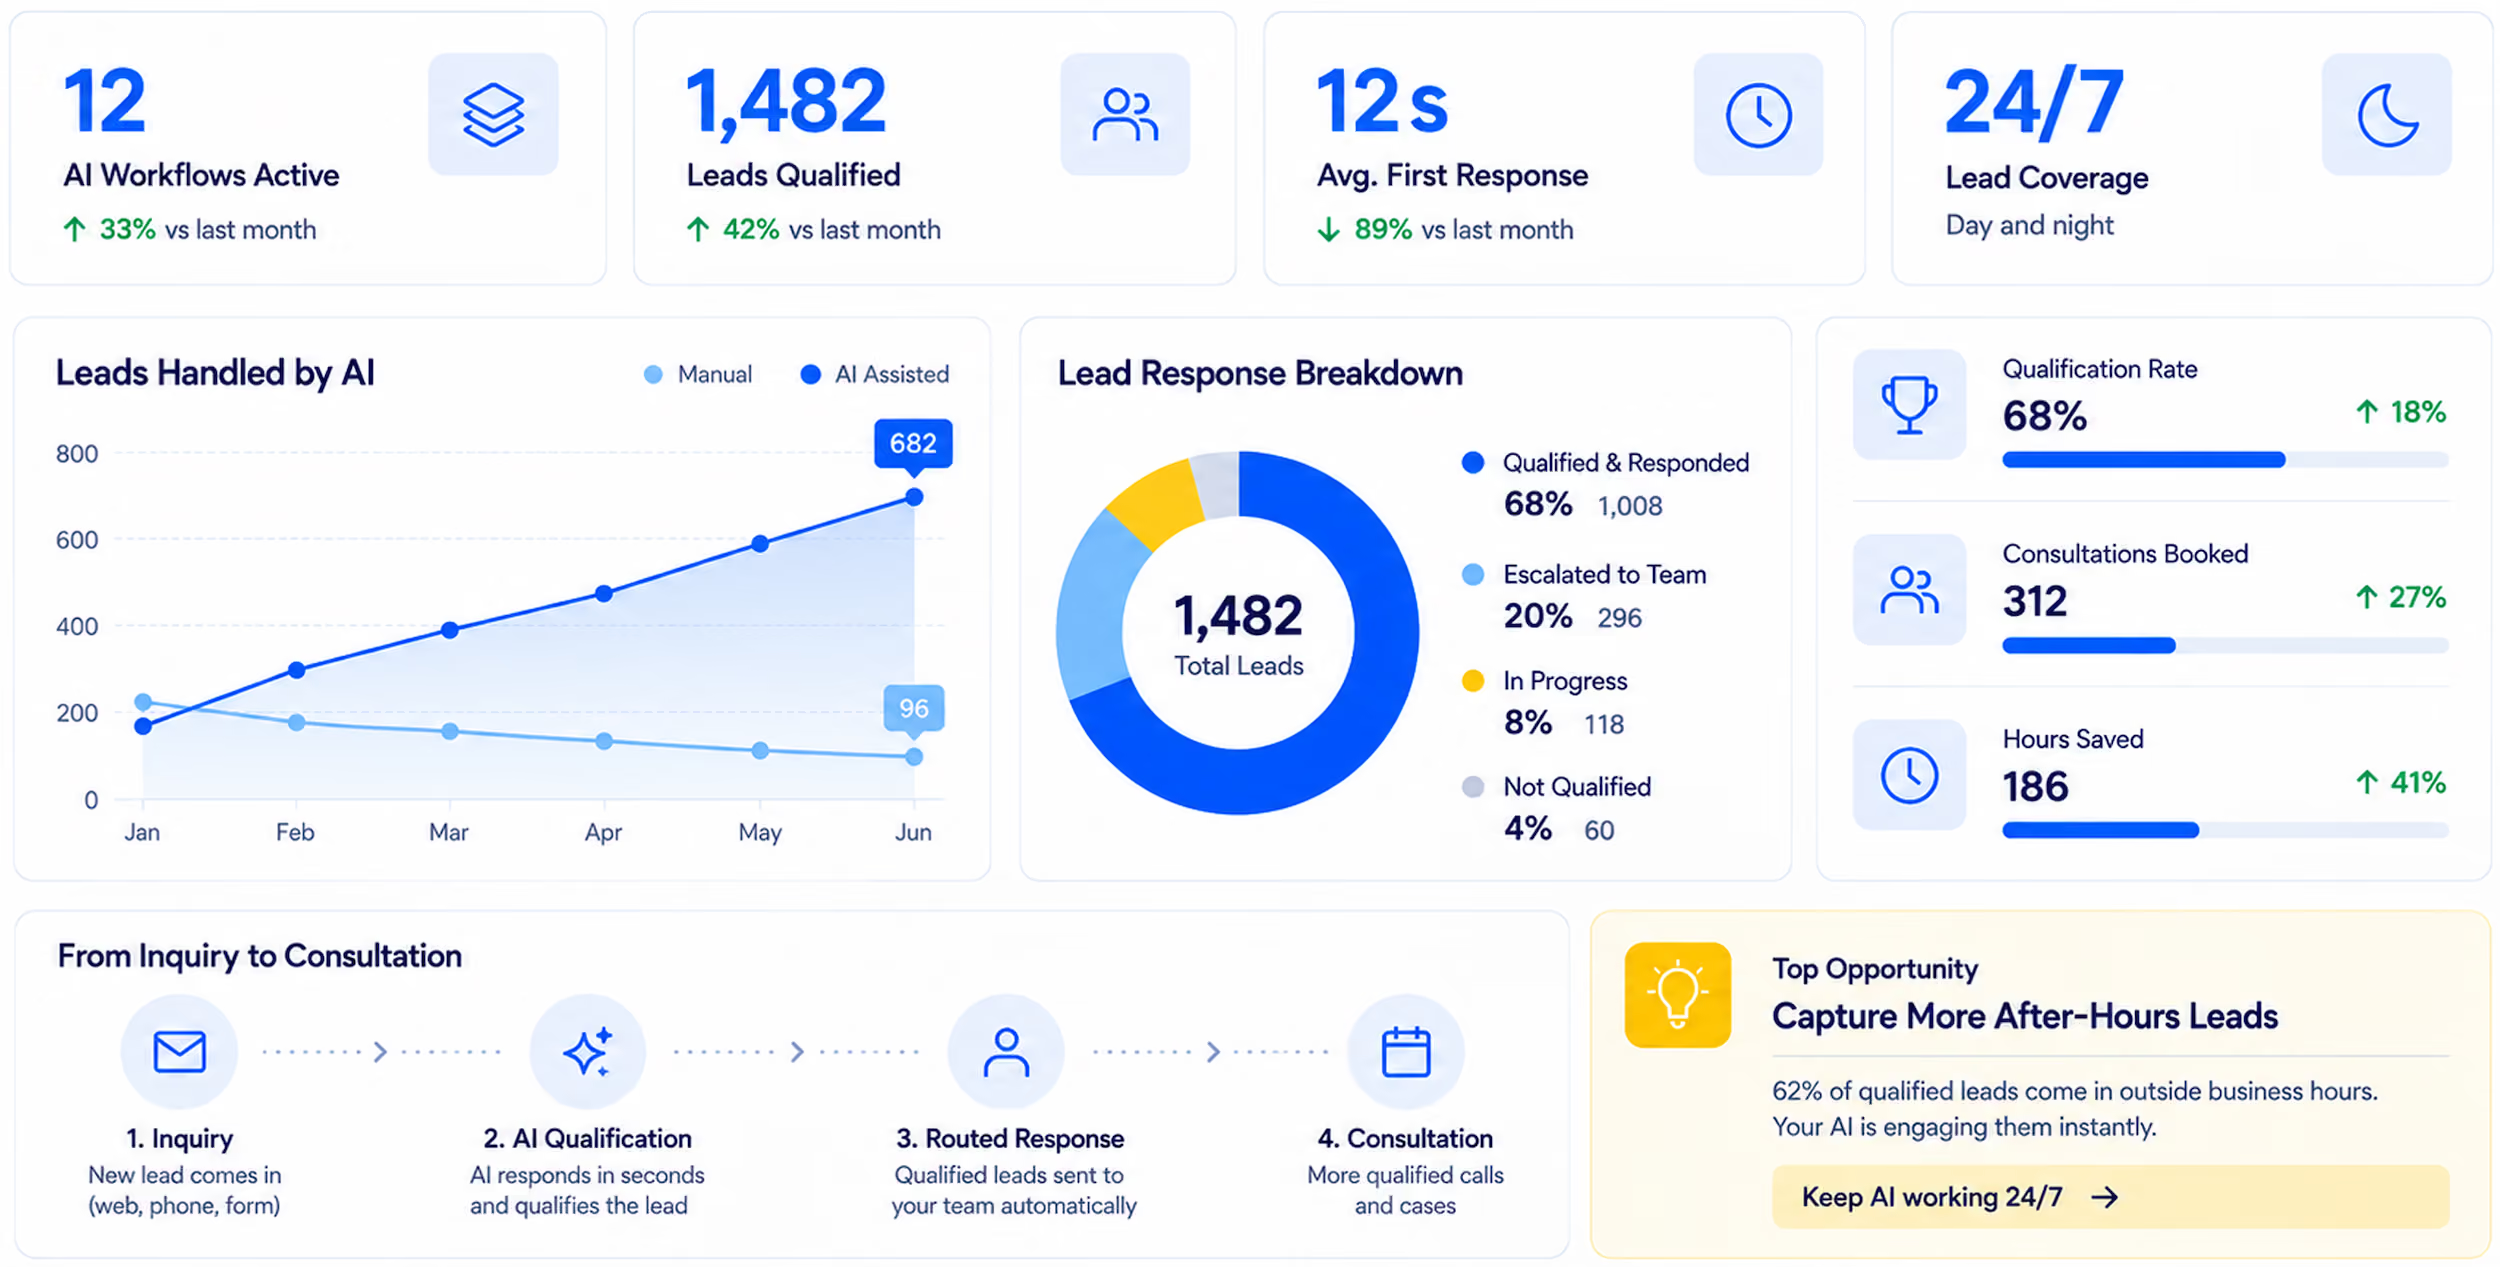
Dashboard showing AI active workflows at 12 with 33% increase, 1,482 leads qualified with 42% increase, average first response time 12 seconds improving 89%, and 24/7 lead coverage. Graph shows leads handled by AI rising to 682 AI-assisted leads and 96 manual leads from January to June. Pie chart breaks down 1,482 total leads: 68% qualified and responded, 20% escalated to team, 8% in progress, 4% not qualified. Metrics show 68% qualification rate with 18% increase, 312 consultations booked up 27%, and 186 hours saved up 41%. Four steps from inquiry to consultation: Inquiry, AI Qualification, Routed Response, and Consultation. Highlighted opportunity to capture more after-hours leads with AI working 24/7.

Social Media & Website Services

Keep your social media and website active and professional so potential clients can find your firm, understand your services, and take the next step.
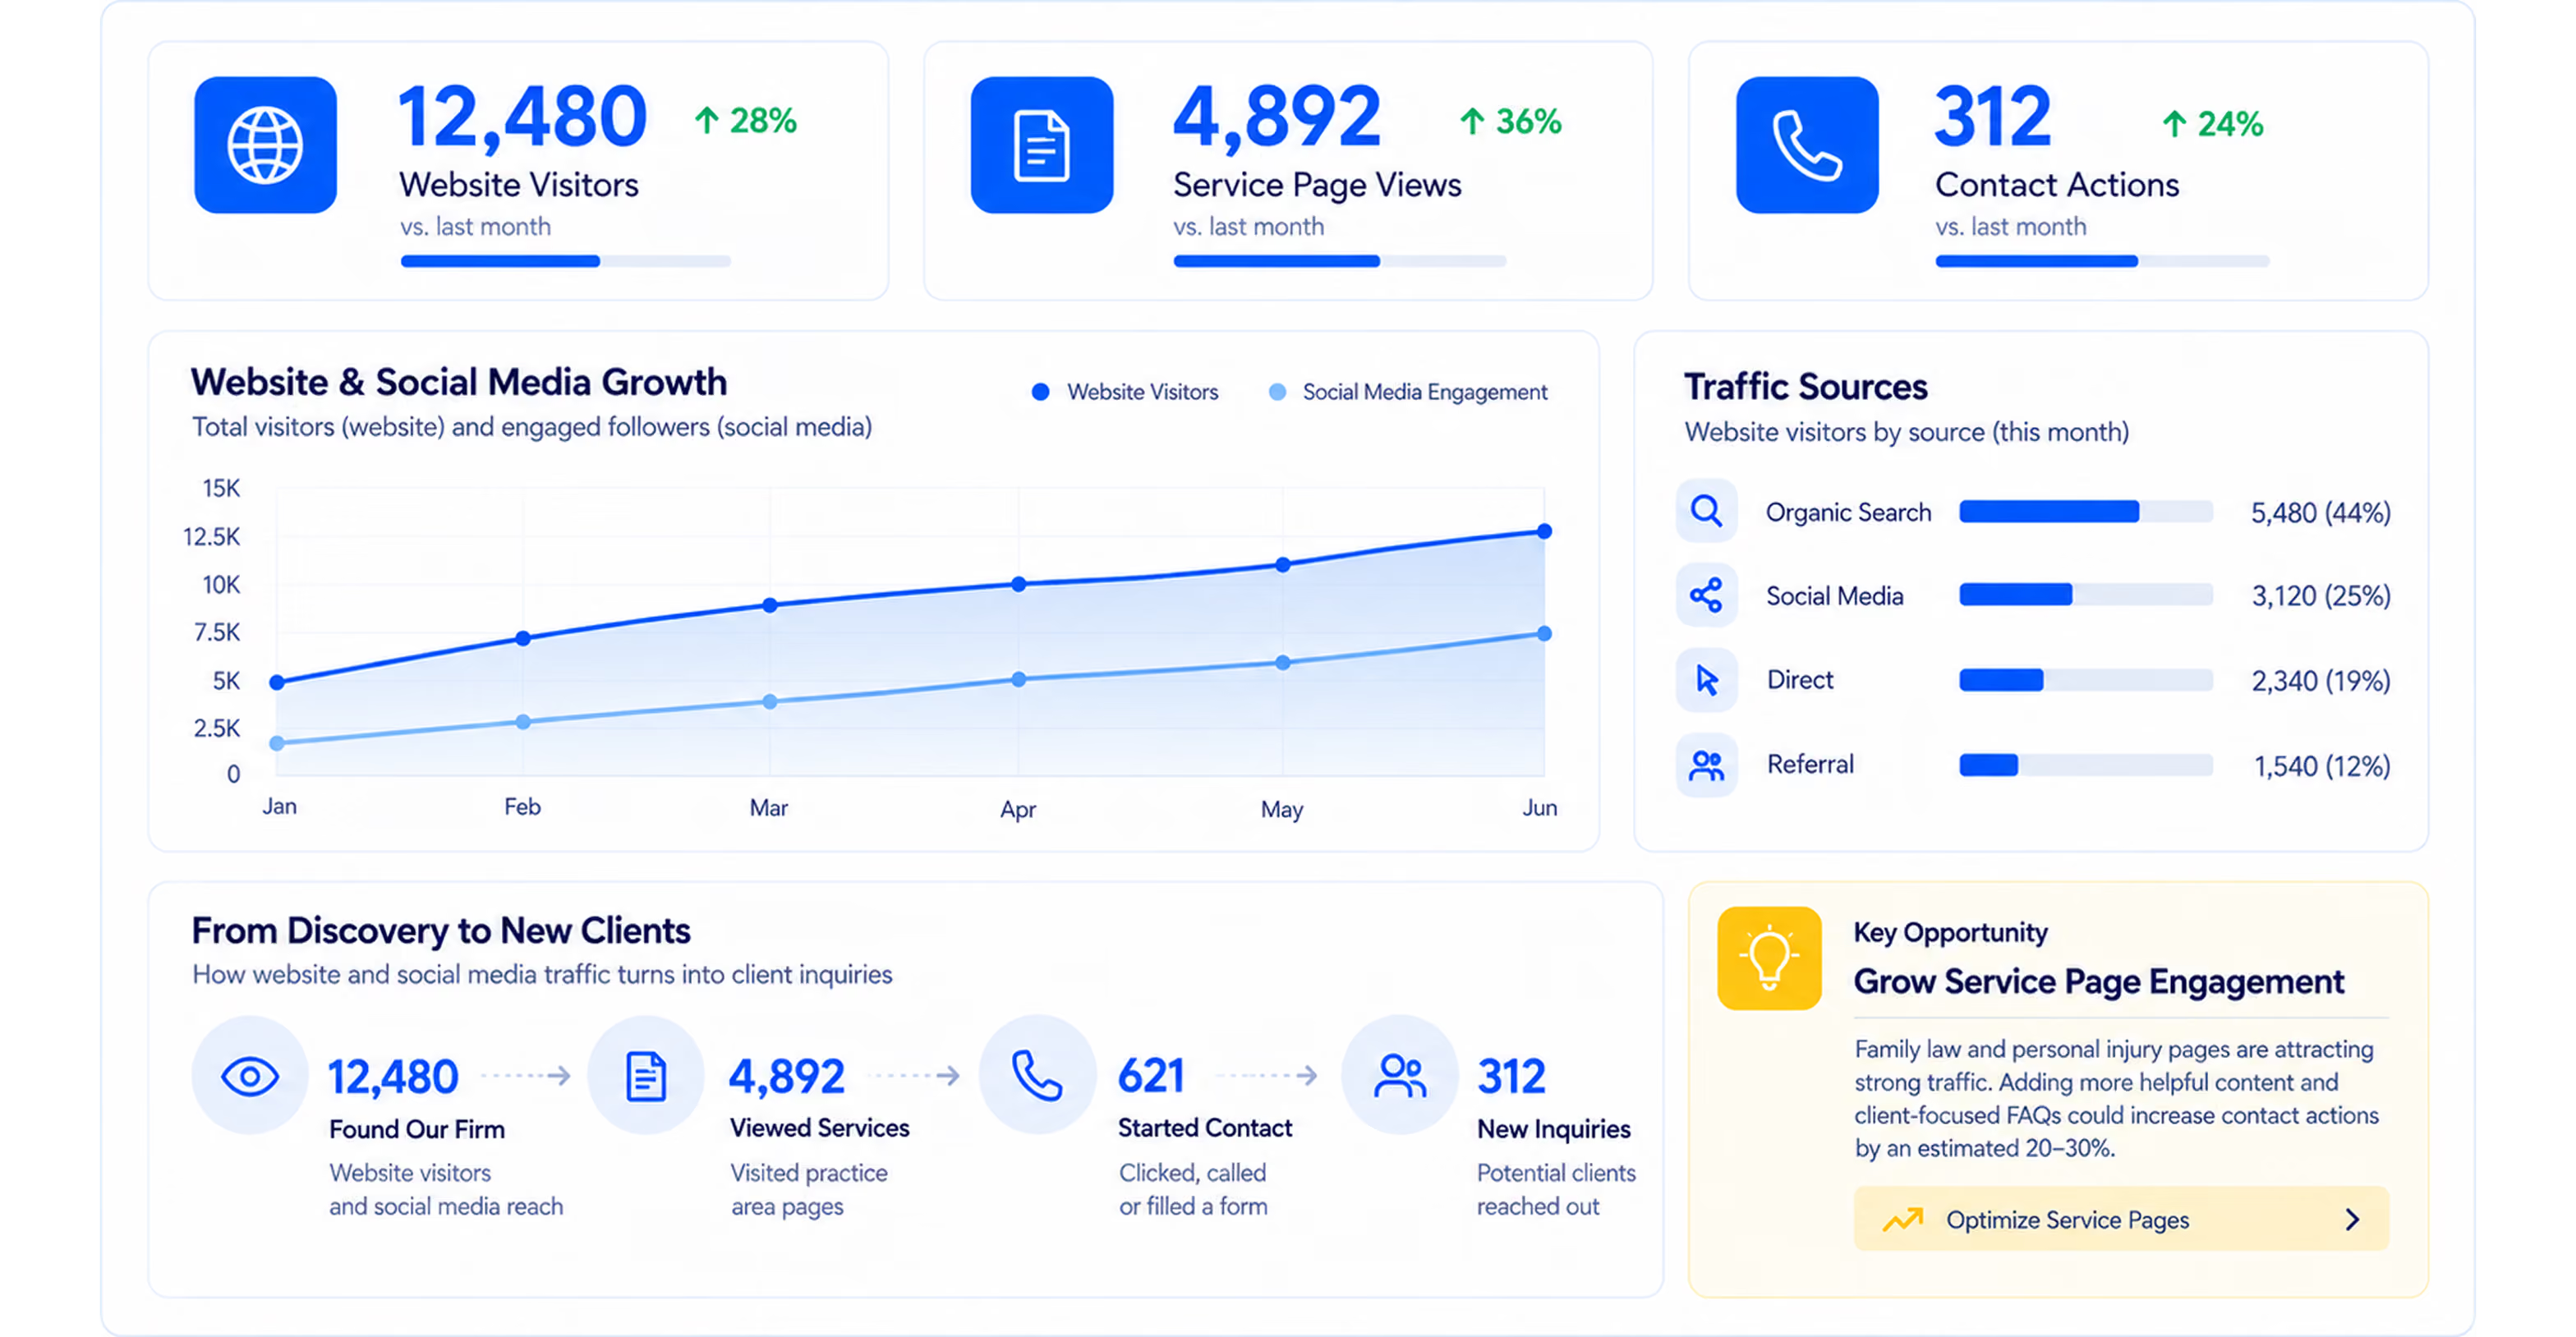
Dashboard showing digital marketing metrics: Website Visitors 12,480 up 28%, Service Page Views 4,892 up 36%, Contact Actions 312 up 24%. Line chart displays growth from January to June in Website Visitors and Social Media Engagement. Traffic Sources list Organic Search 5,480 (44%), Social Media 3,120 (25%), Direct 2,340 (19%), Referral 1,540 (12%). Flow chart from Discovery to New Clients shows 12,480 found the firm, 4,892 viewed services, 621 started contact, 312 new inquiries. Key opportunity noted to grow Service Page Engagement with a prompt to optimize service pages.

Marketing and Growth

Growth comes from consistent visibility. P360 builds the marketing and referral pipelines that keep cases coming in.
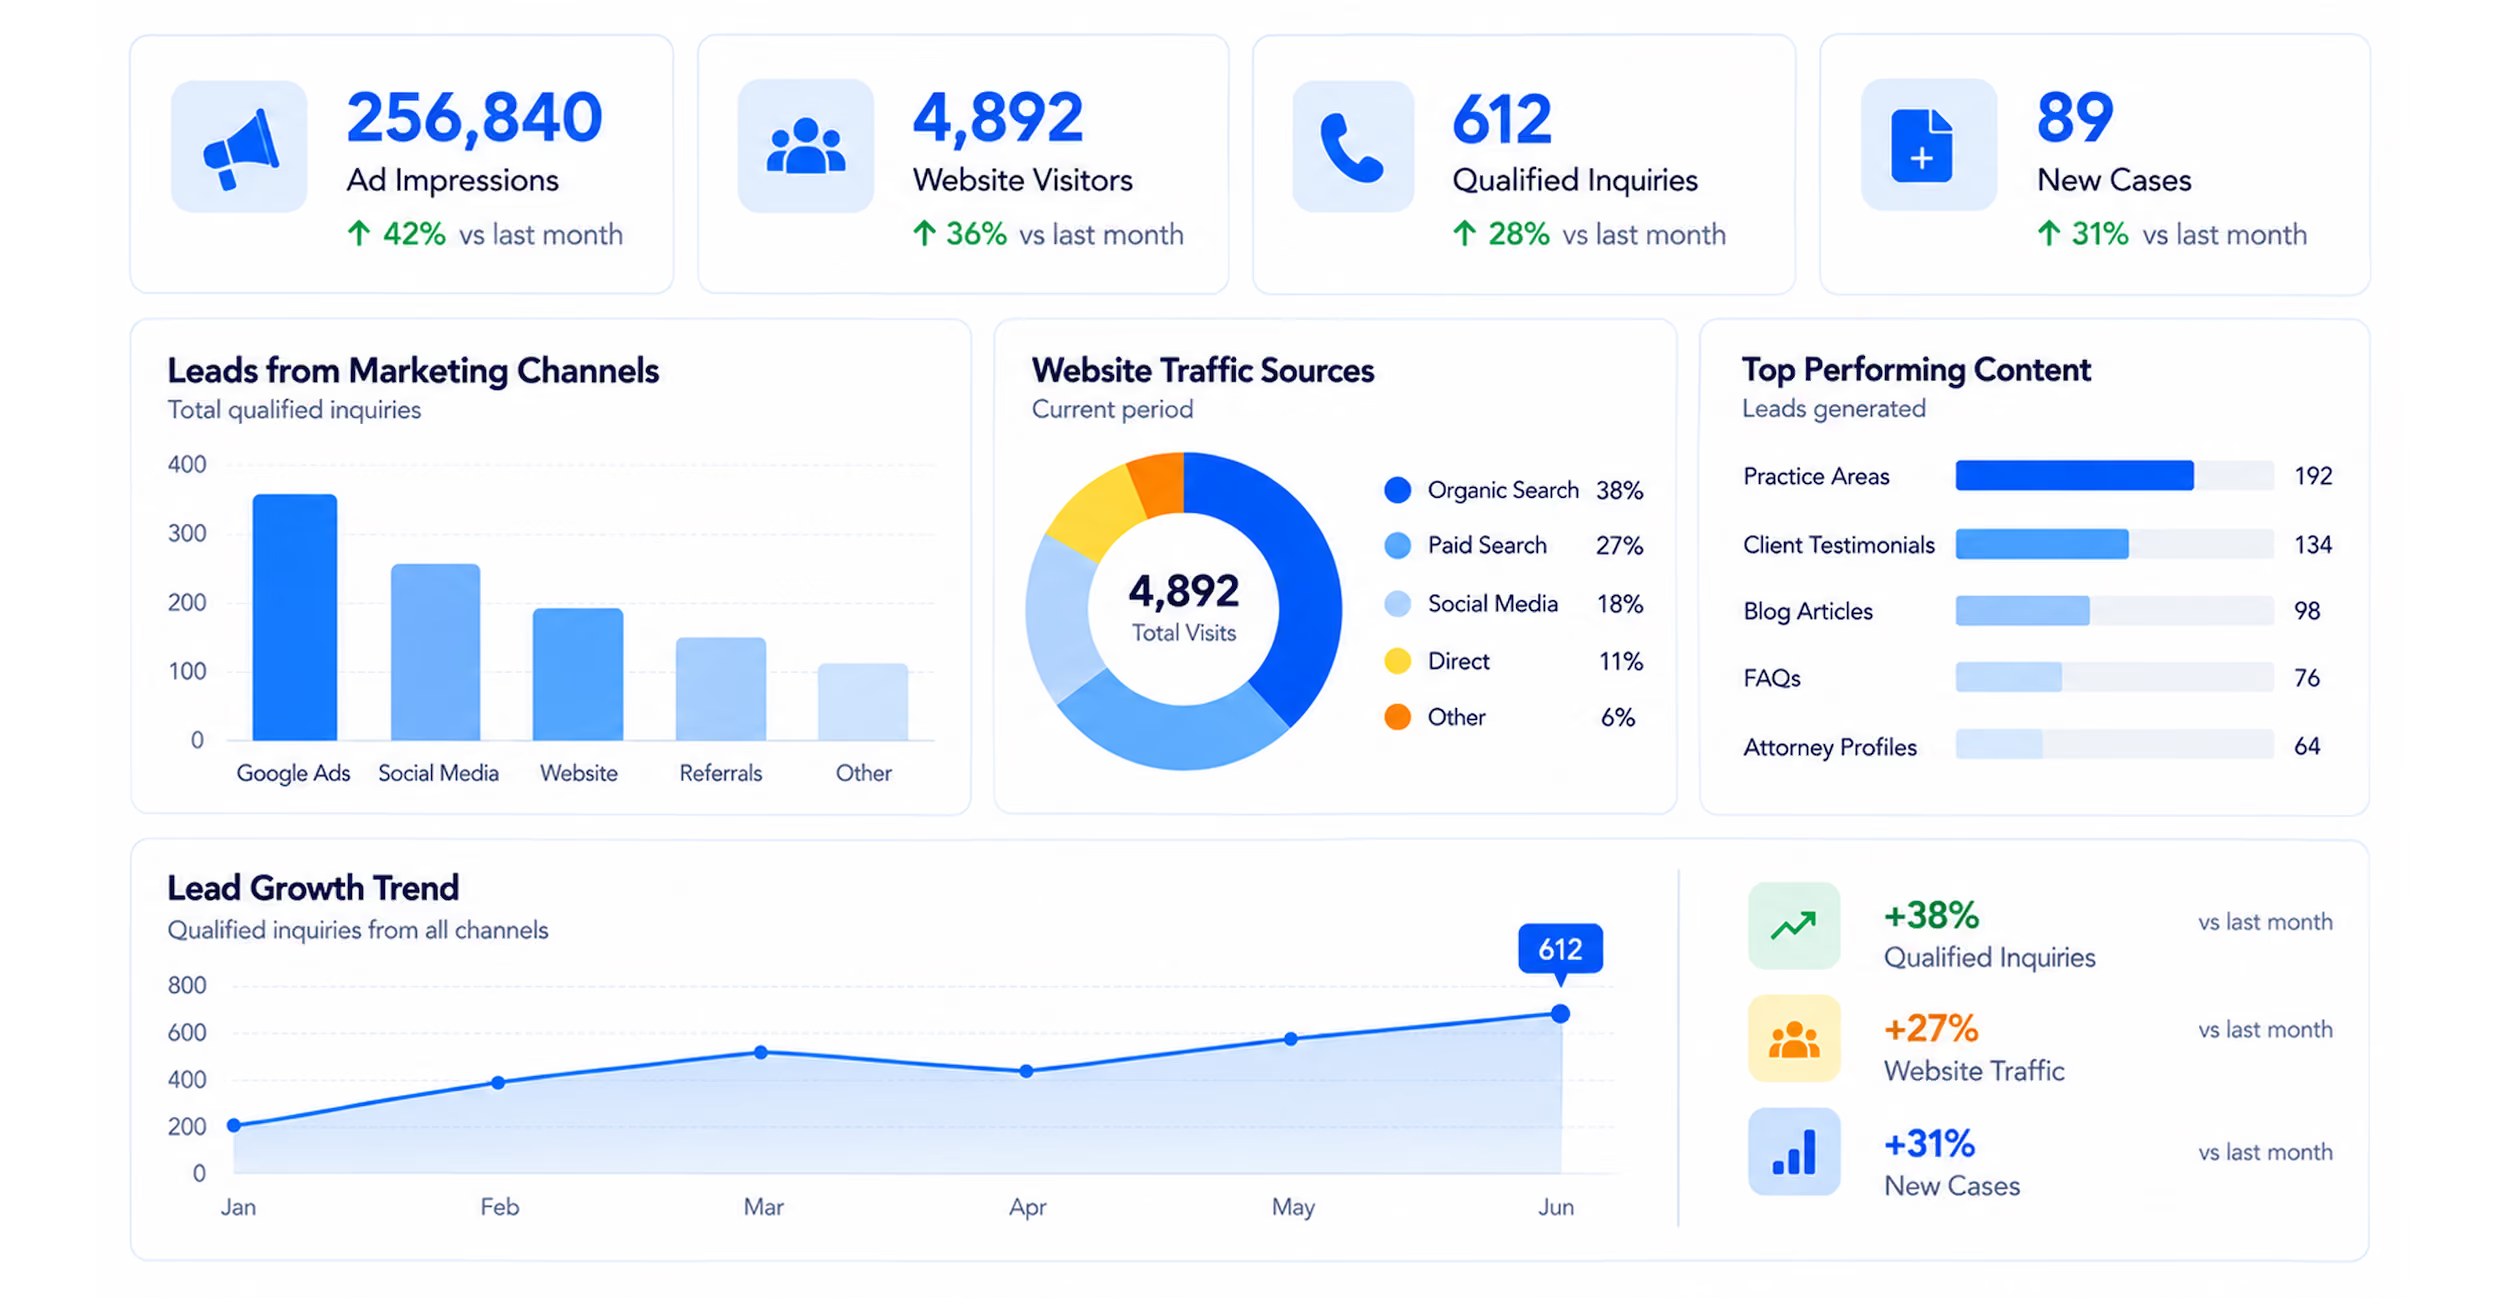
Marketing and growth dashboard showing 256,840 ad impressions, 4,892 website visitors, 612 qualified inquiries, and 89 new cases, each with percentage increase vs last month. Bar chart of leads from marketing channels with Google Ads highest, followed by Social Media, Website, Referrals, and Other. Pie chart of website traffic sources with Organic Search leading at 38%, Paid Search 27%, Social Media 18%, Direct 11%, and Other 6%. Top performing content bars show Practice Areas leading with 192 leads, Client Testimonials 134, Blog Articles 98, FAQs 76, Attorney Profiles 64. Lead growth trend line chart from January to June shows an increase to 612 qualified inquiries. Percent changes +38% qualified inquiries, +27% website traffic, +31% new cases vs last month.

HR and Staffing

Understaffed intake means missed cases and burned-out teams. P360 recruits and manages the staff your firm needs to scale.
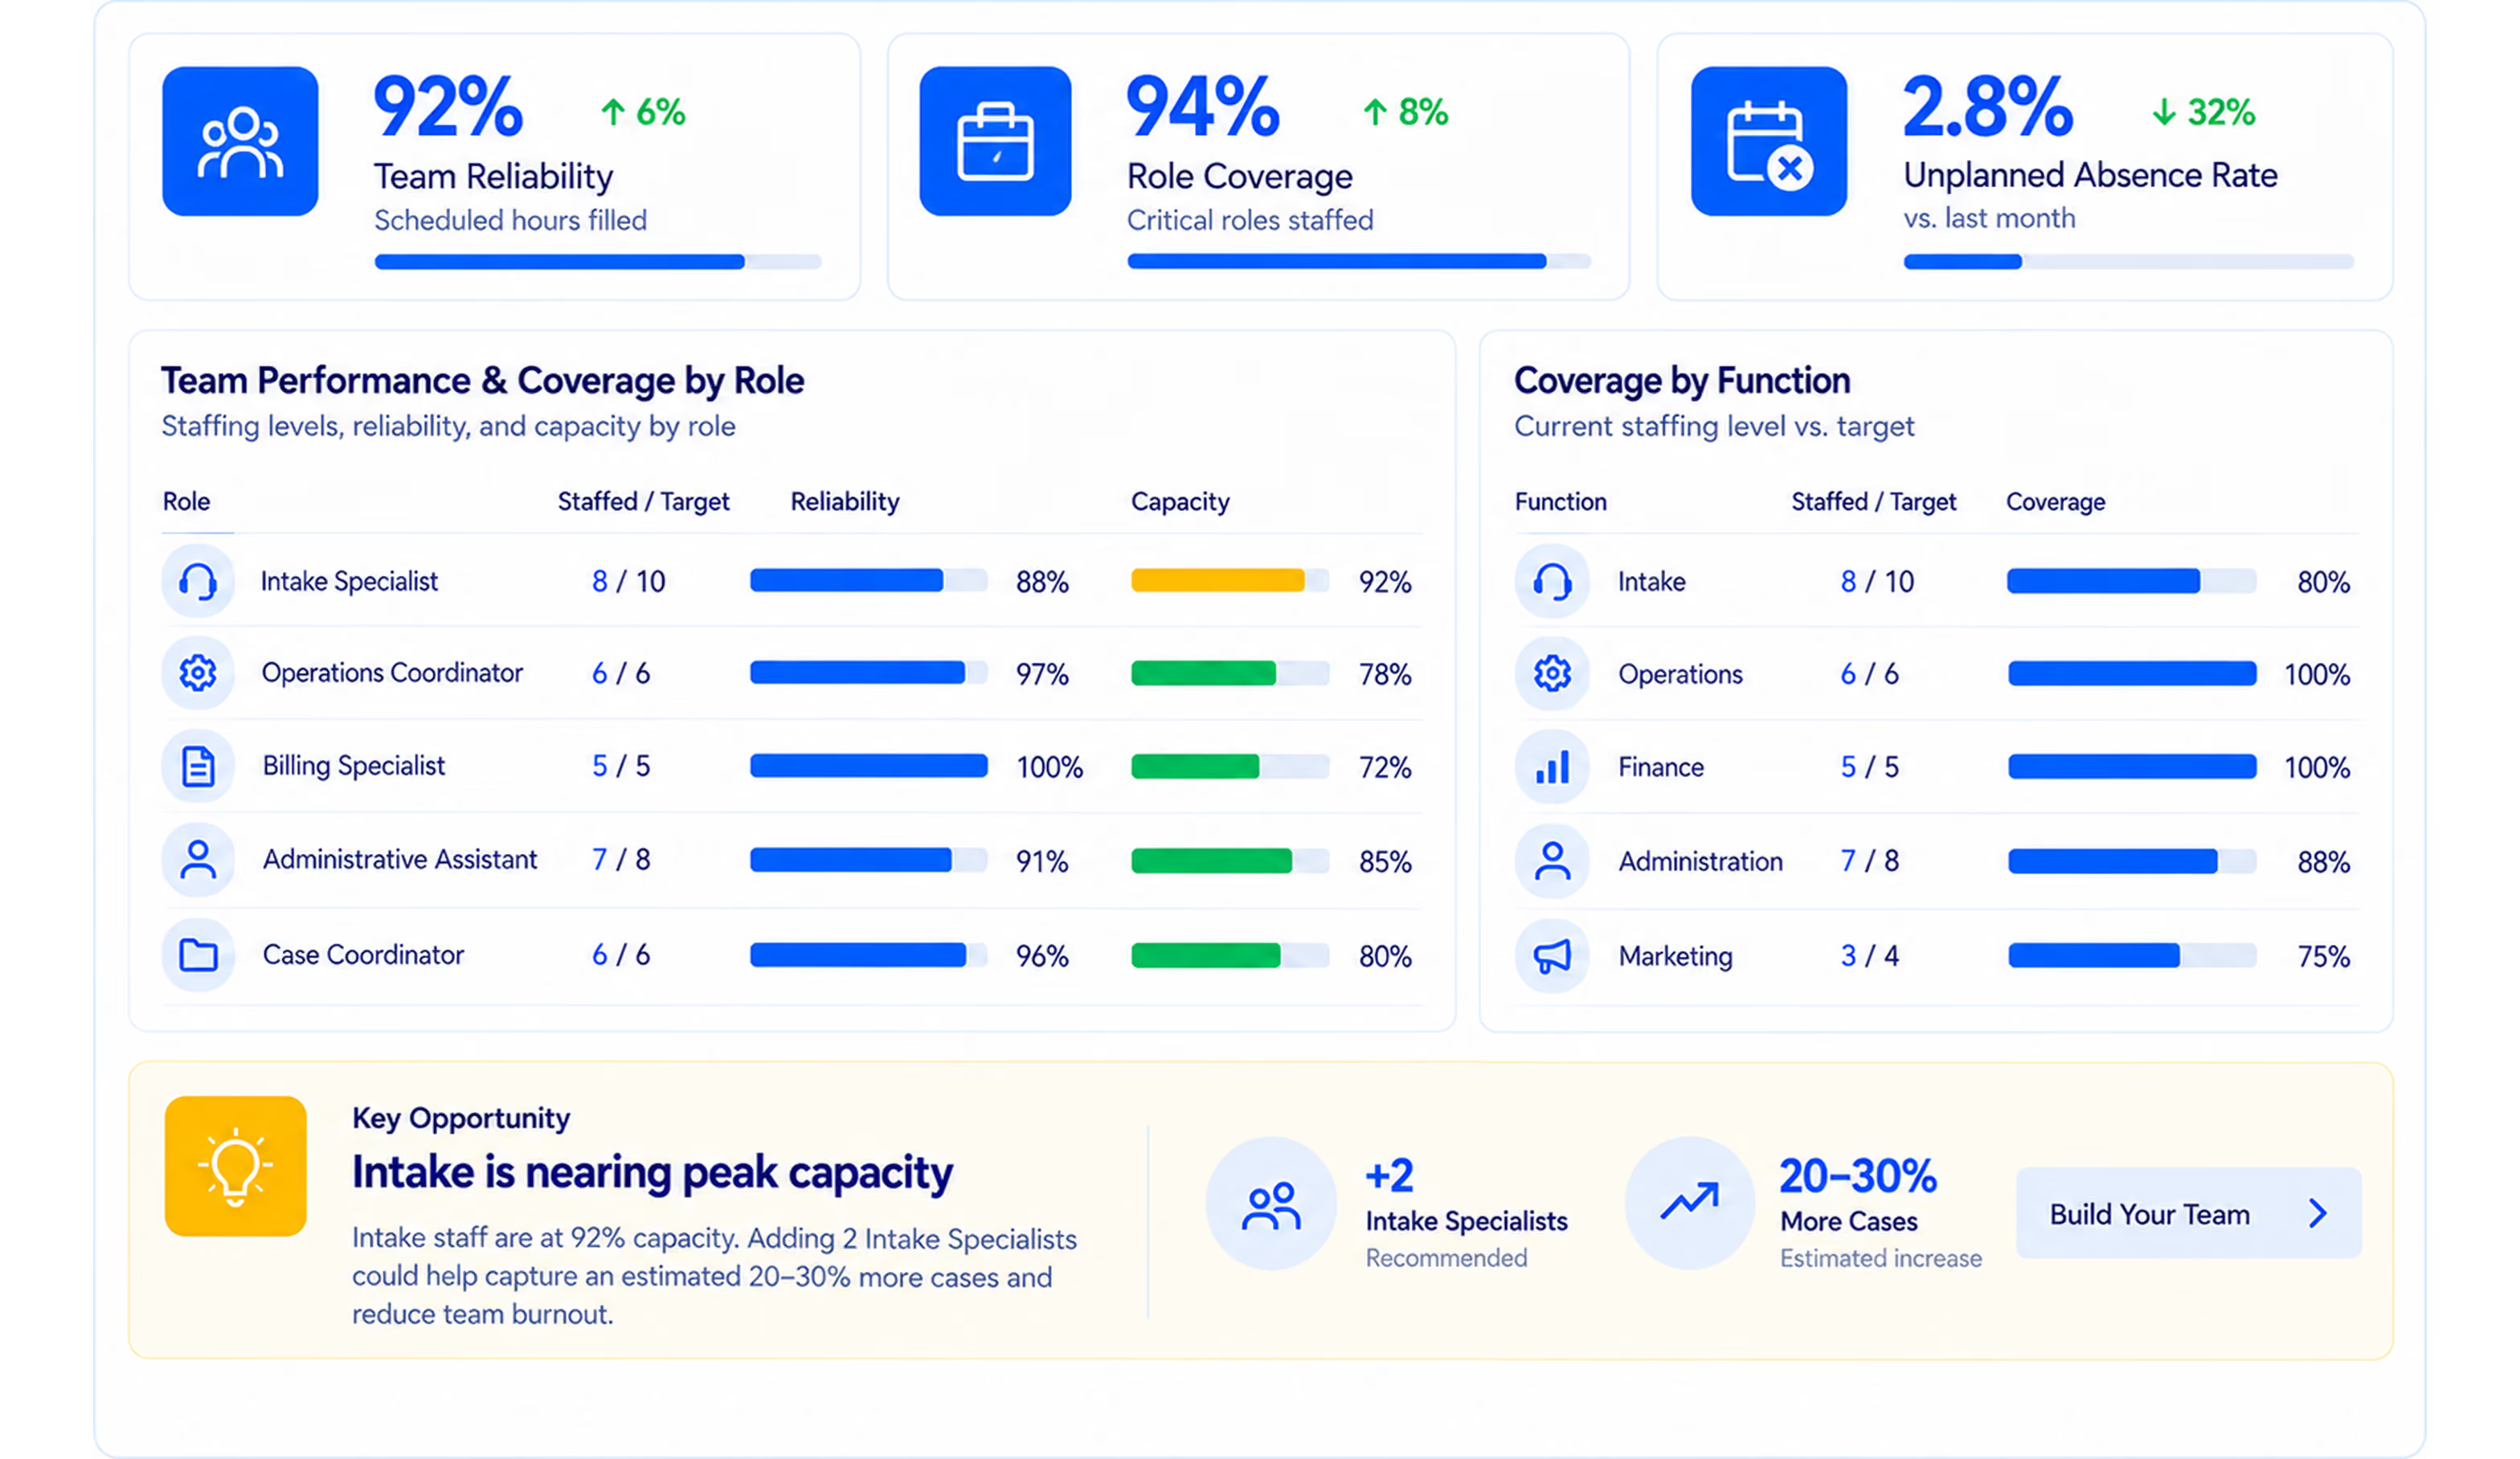
Dashboard showing team reliability at 92% with a 6% increase, role coverage at 94% with an 8% increase, and unplanned absence rate at 2.8% with a 32% decrease. Team performance and coverage by role display staffed versus target, reliability, and capacity for Intake Specialist (8/10 staffed, 88% reliability, 92% capacity), Operations Coordinator (6/6, 97%, 78%), Billing Specialist (5/5, 100%, 72%), Administrative Assistant (7/8, 91%, 85%), and Case Coordinator (6/6, 96%, 80%). Coverage by function shows Intake (8/10, 80%), Operations (6/6, 100%), Finance (5/5, 100%), Administration (7/8, 88%), Marketing (3/4, 75%). Key opportunity highlights Intake near peak capacity at 92%, recommending adding 2 Intake Specialists to capture 20-30% more cases and reduce burnout, with a call to action button labeled Build Your Team.

Reporting & Analytics

Firms that can't track conversion can't fix what's broken. P360 monitors every lead from first contact to retained case.
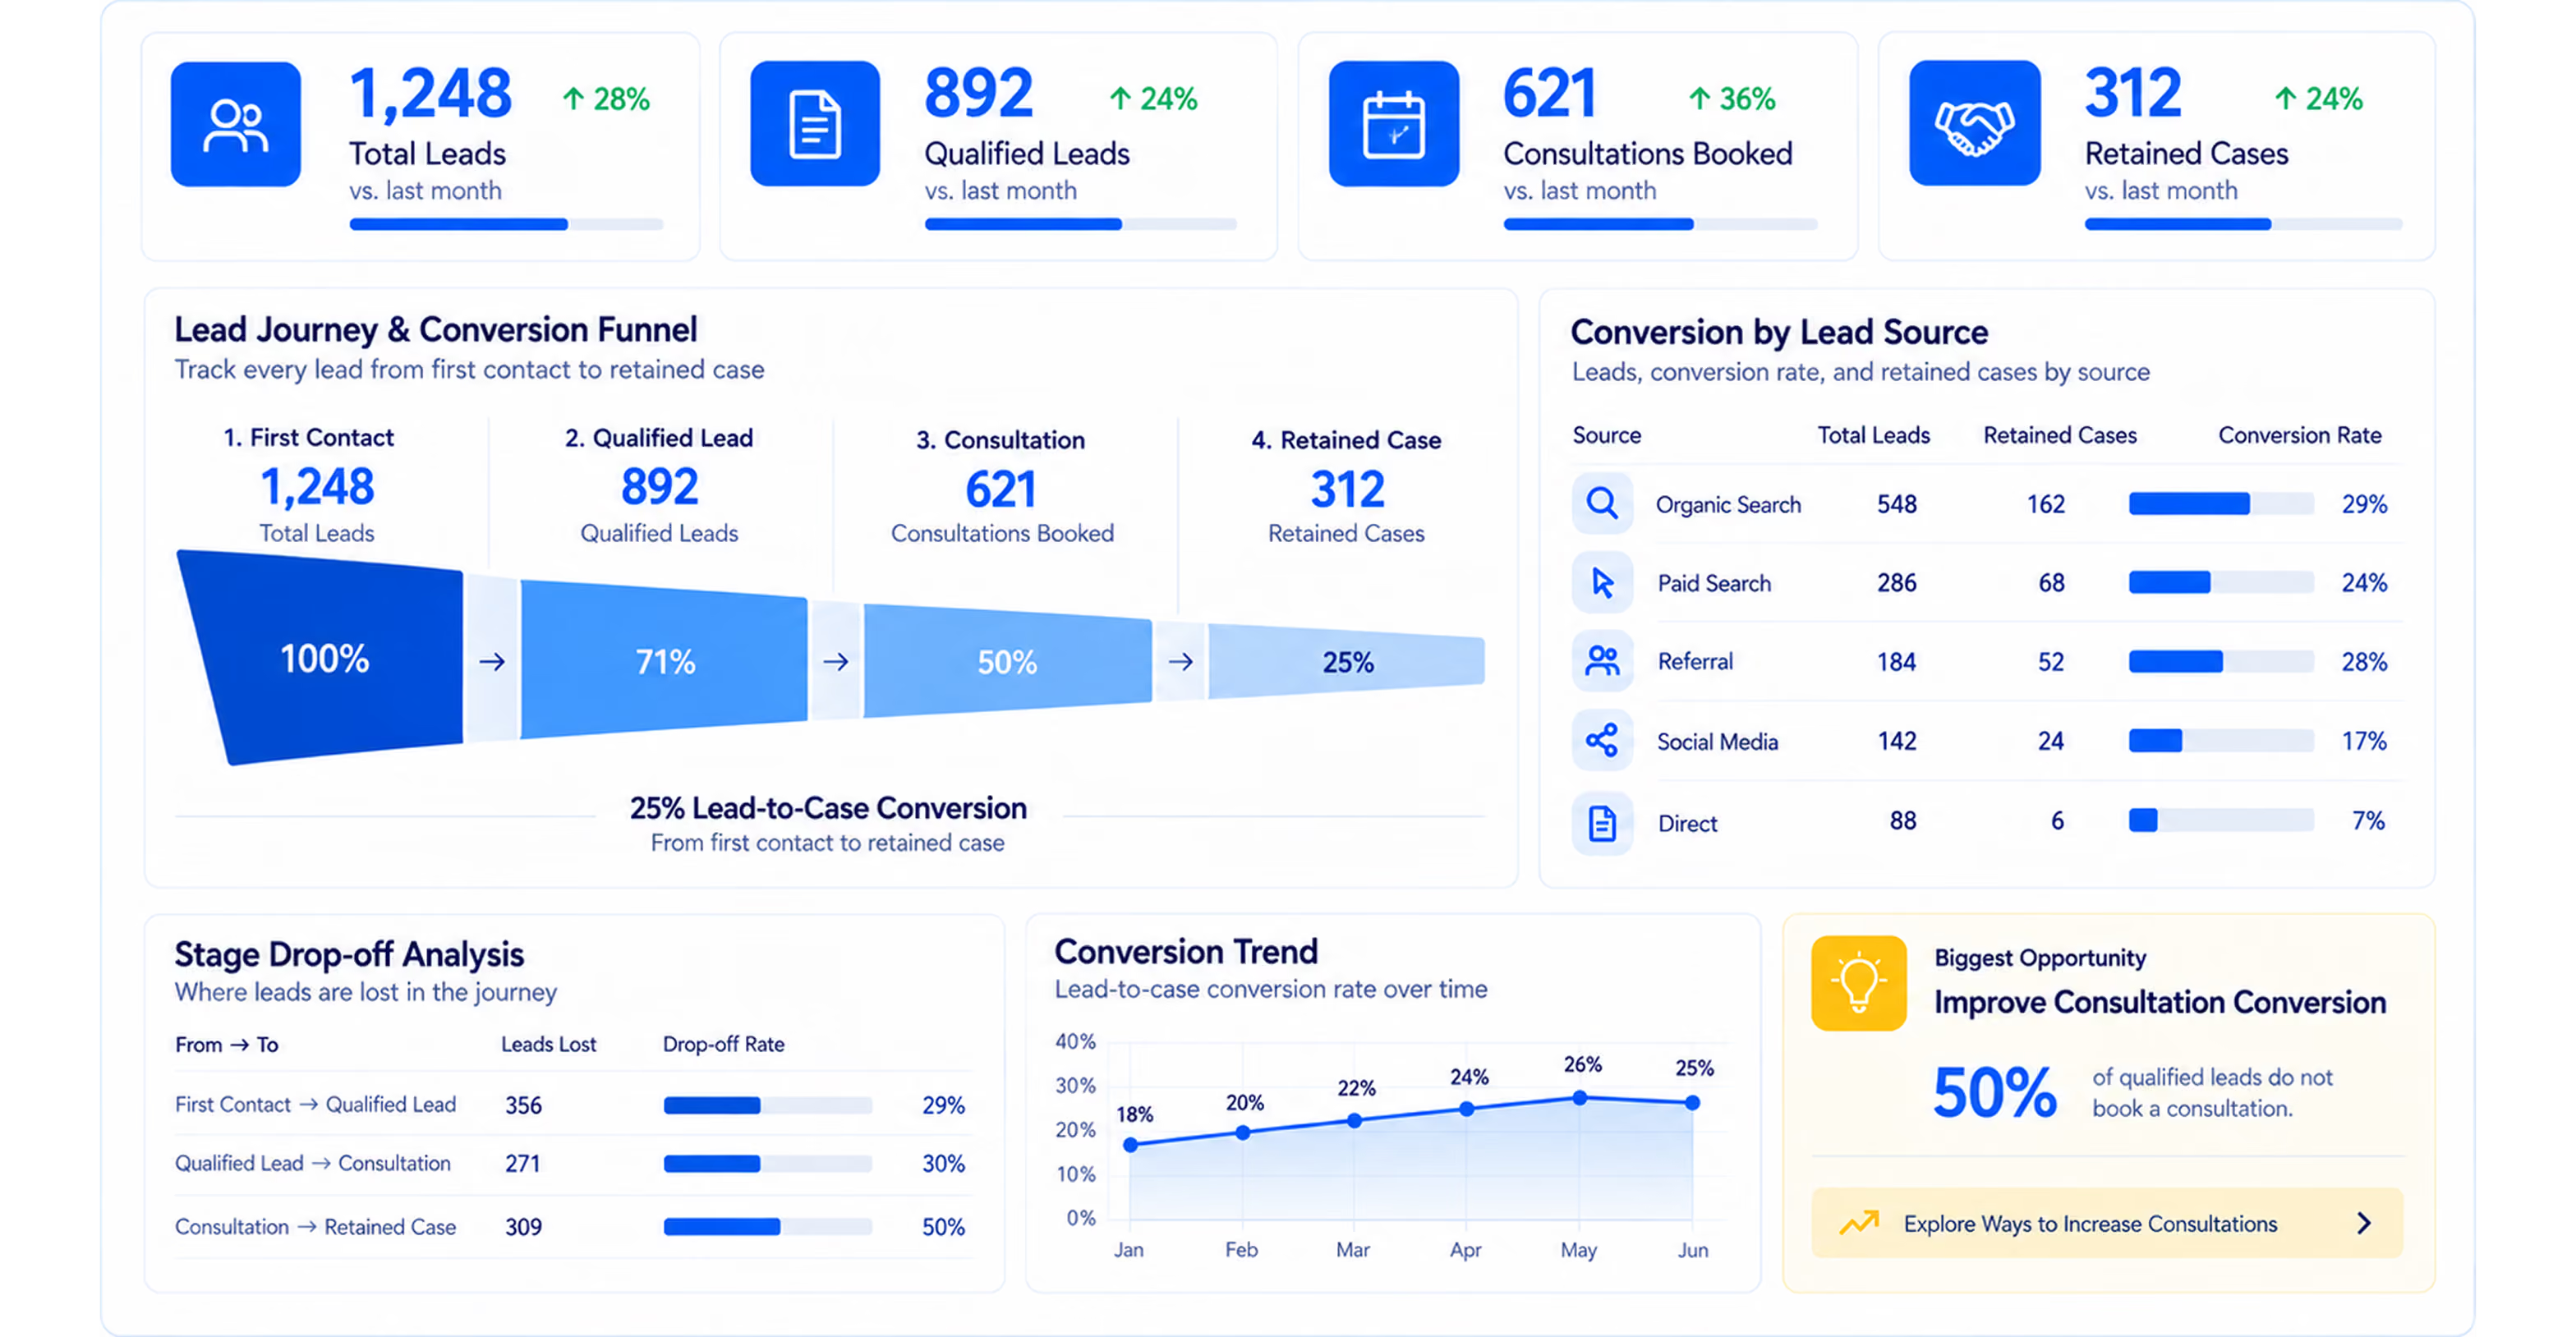
Dashboard showing lead and case metrics with 1,248 total leads (up 28%), 892 qualified leads (up 24%), 621 consultations booked (up 36%), and 312 retained cases (up 24%). Lead conversion funnel: 100% first contact, 71% qualified leads, 50% consultations booked, 25% retained cases. Conversion by lead source: organic search leads 548 with 29% conversion, paid search 286 with 24%, referral 184 with 28%, social media 142 with 17%, direct 88 with 7%. Stage drop-off analysis shows leads lost and drop-off rates between stages: first contact to qualified lead 356 lost (29%), qualified lead to consultation 271 lost (30%), consultation to retained case 309 lost (50%). Conversion trend graph shows lead-to-case conversion increasing from 18% in January to 25% in June. Biggest opportunity: improve consultation conversion since 50% of qualified leads do not book consultations.

Practice Management

Disorganized workflows slow down every case your firm takes on. P360 coordinates the daily operations that keep cases moving.
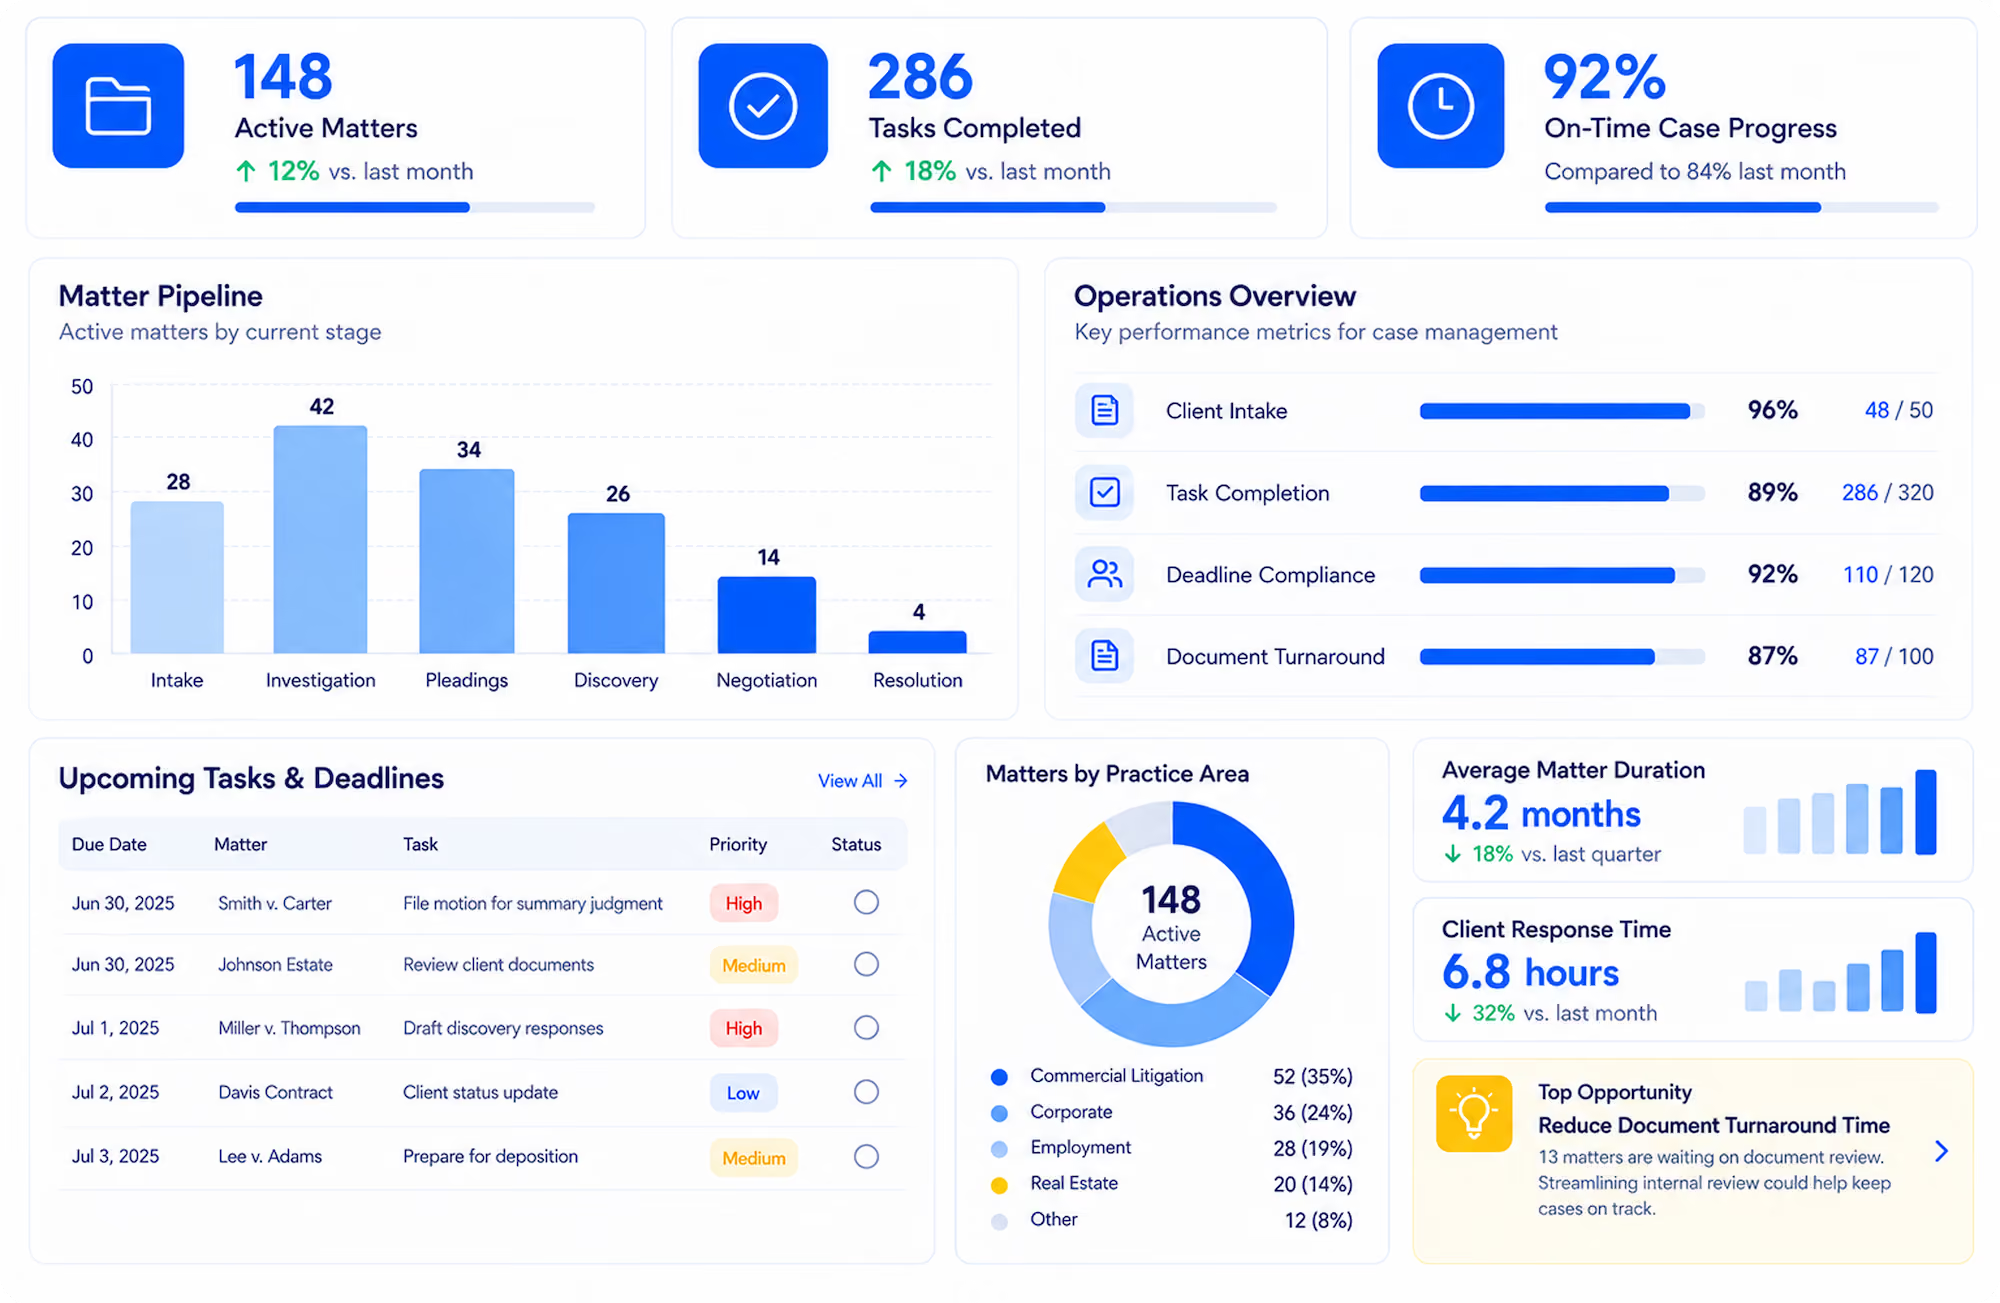
Dashboard showing legal practice management metrics including 148 active matters up 12%, 286 tasks completed up 18%, and 92% on-time case progress. A matter pipeline bar chart shows active matters by stage: Intake 28, Investigation 42, Pleadings 34, Discovery 26, Negotiation 14, Resolution 4. Operations overview lists client intake 96%, task completion 89%, deadline compliance 92%, document turnaround 87%. Upcoming tasks with due dates, matters, tasks, priority, and status. Matters by practice area pie chart with commercial litigation 35%, corporate 24%, employment 19%, real estate 14%, other 8%. Average matter duration is 4.2 months down 18%. Client response time 6.8 hours down 32%. Top opportunity highlights reducing document turnaround time for 13 matters waiting on review.

Finance and Accounting

P360 supports the reporting and reconciliation that keep your books audit-ready.
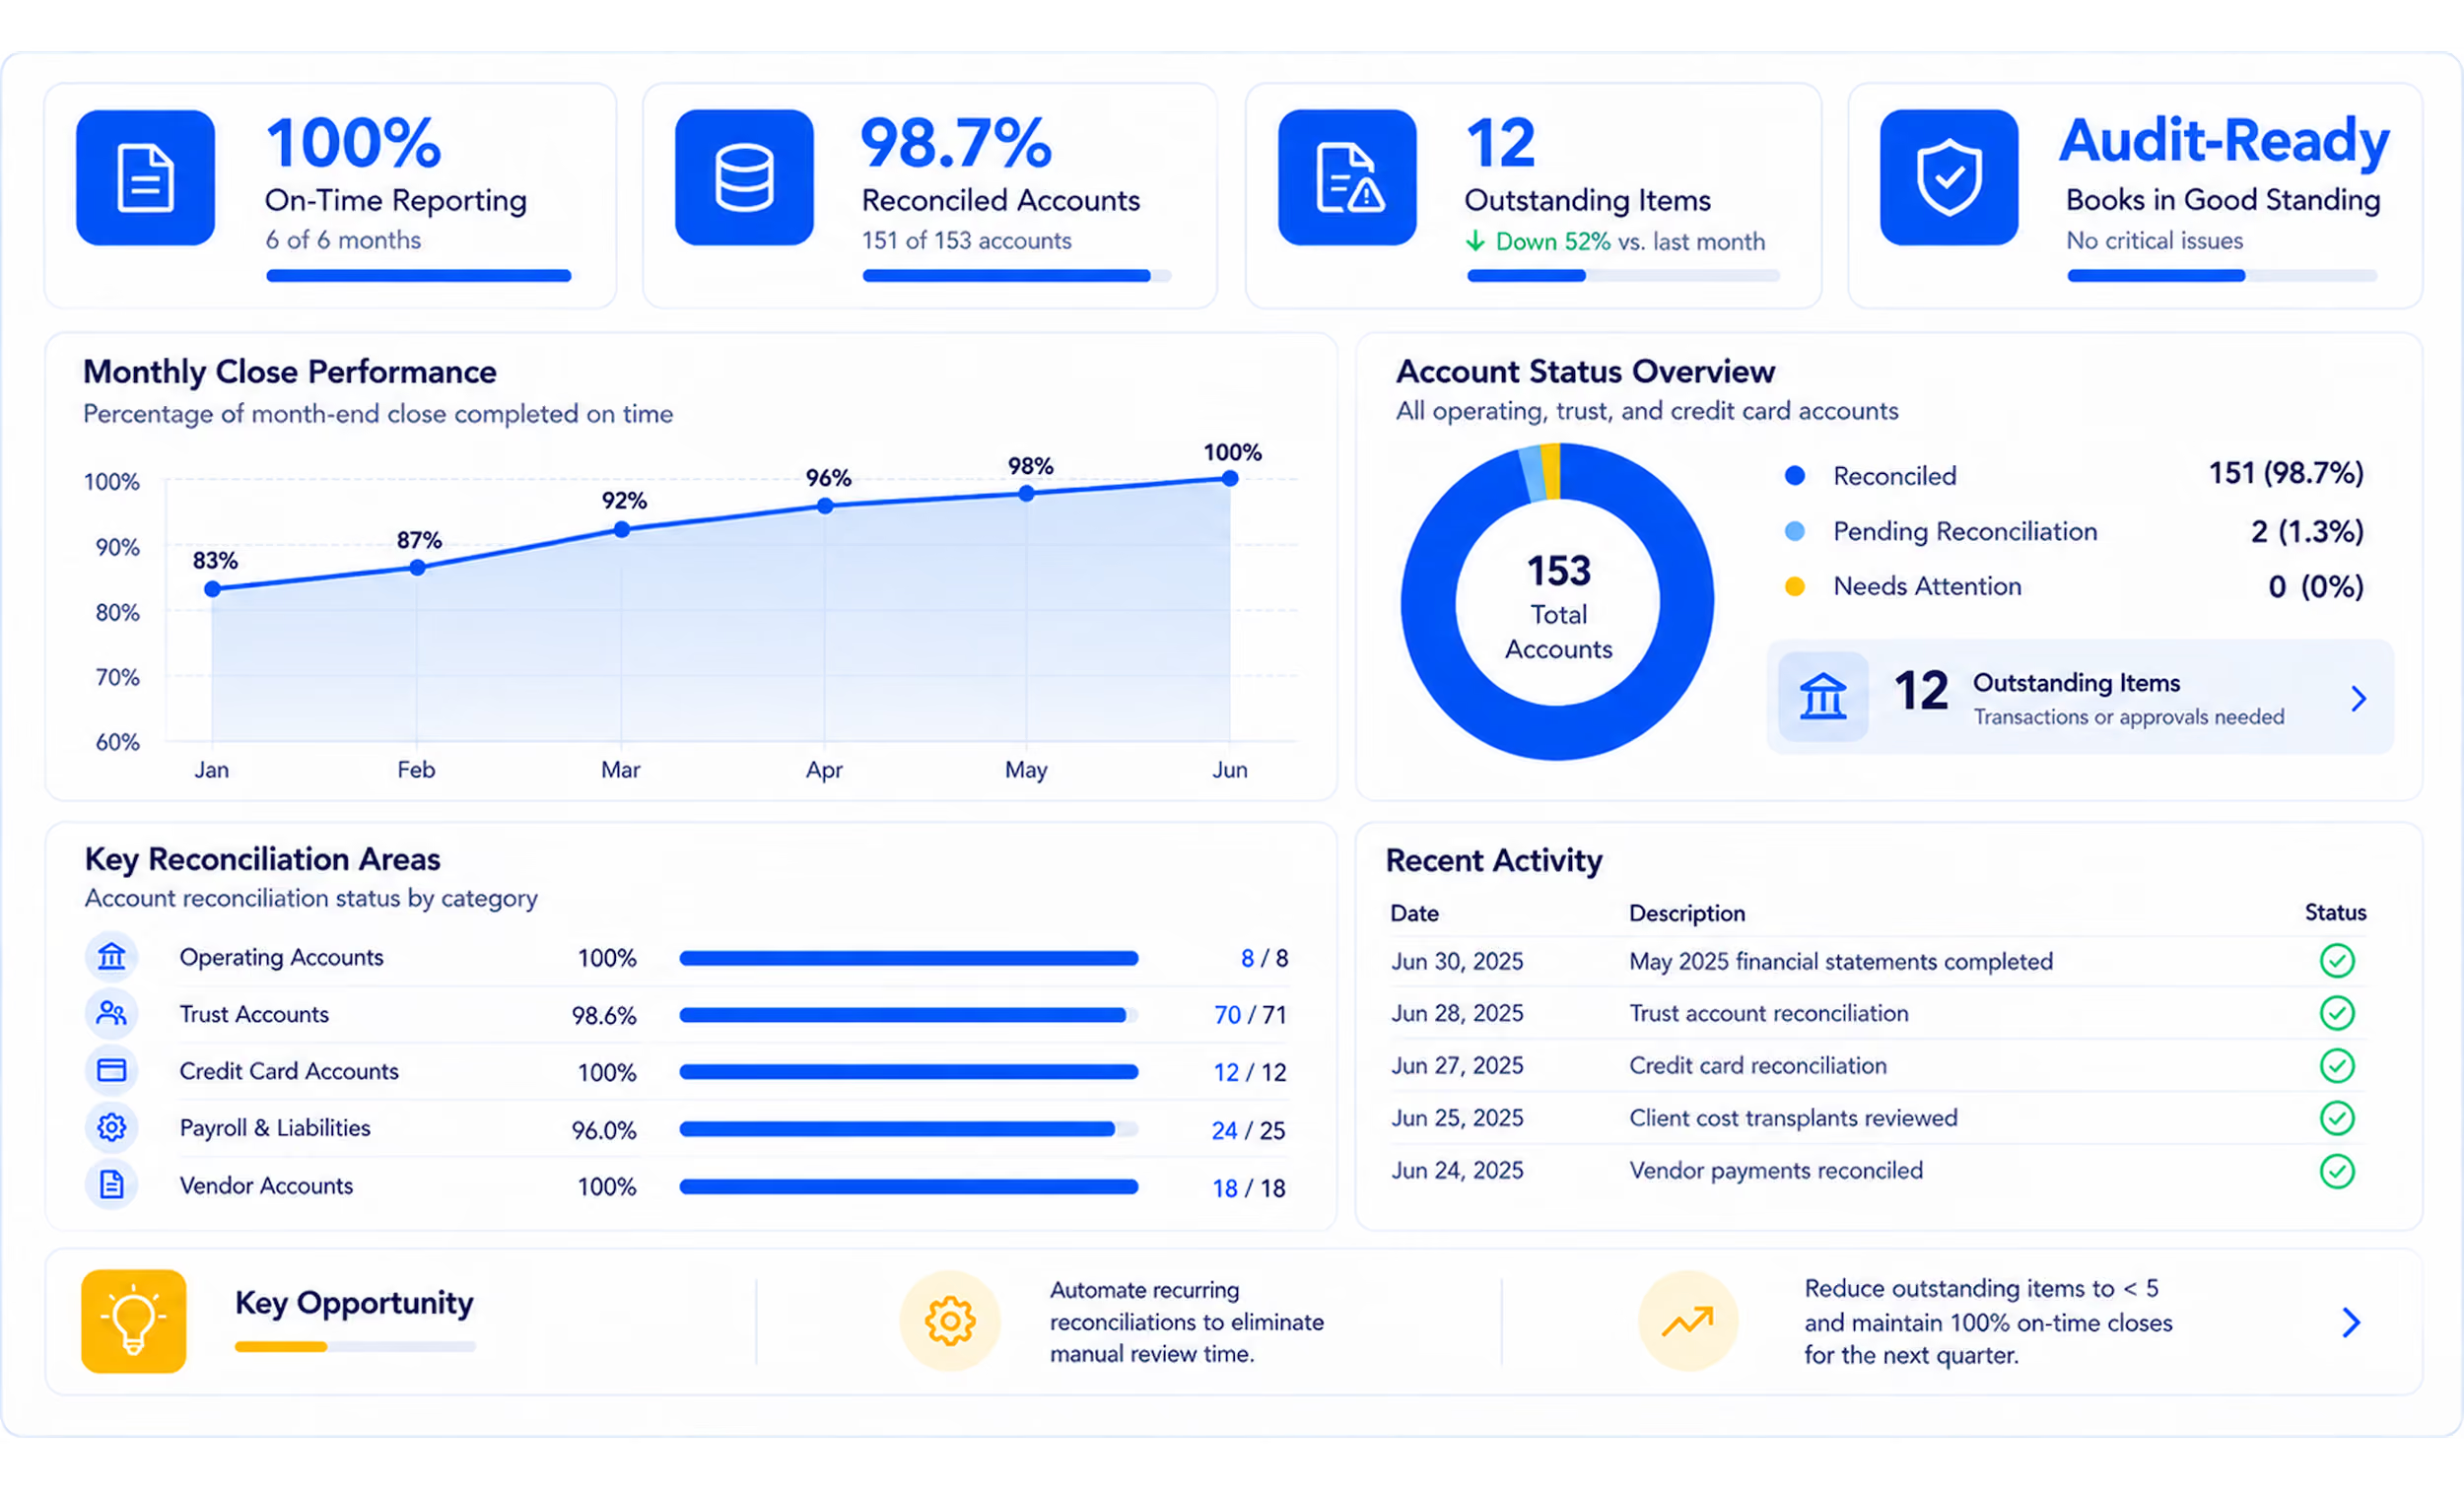
Finance dashboard showing 100% on-time reporting for 6 months, 98.7% reconciled accounts of 153, 12 outstanding items down 52% vs last month, and audit-ready status with no critical issues. Monthly close performance line chart shows improvement from 83% in January to 100% in June. Account status overview pie chart displays 151 reconciled accounts, 2 pending reconciliation, 0 needs attention. Key reconciliation areas show high percentages for Operating, Trust, Credit Card, Payroll, and Vendor accounts. Recent activity lists completed reconciliations and reviewed cost transplants from June 24-30, 2025. Key opportunity notes automating recurring reconciliations and reducing outstanding items to under 5 while maintaining 100% on-time closes.

Legal Practices We Serve

Every practice area runs on different rules and rhythms. P360 tailors intake, documentation, and coordination to how your specific practice actually operates.

Personal Injury

Capture critical case details and records from the first inquiry.

Family Law

Provide responsive intake and consistent follow-up for sensitive family matters.

Immigration Law

Track filings, documents, and client communication across every case.

Employment Law

Organize evidence, documentation, and deadlines for workplace claims.

Bankruptcy Law

Handle intake and document collection, so petitions go out faster.

Criminal Defense

Manage intake and scheduling so attorneys can focus on defense.

Estate Planning

Guide clients through intake, scheduling, and document follow-up.

Corporate Law

Build the PR and partnerships behind your reputation.

Why Choose P360

We measure performance against the metrics that matter to firm owners. During your evaluation, we establish clear benchmarks and reporting standards based on verified firm data, not assumptions.

Illustration showing a process flow from a phone call notification icon on the left, a stopwatch icon in the center indicating response time, to a user profile card on the right with a green checkmark indicating successful intake or completion.

Intake Response Time

Slow responses lose cases to firms that call back first. We report SLA compliance on response time, so every lead is met with speed.
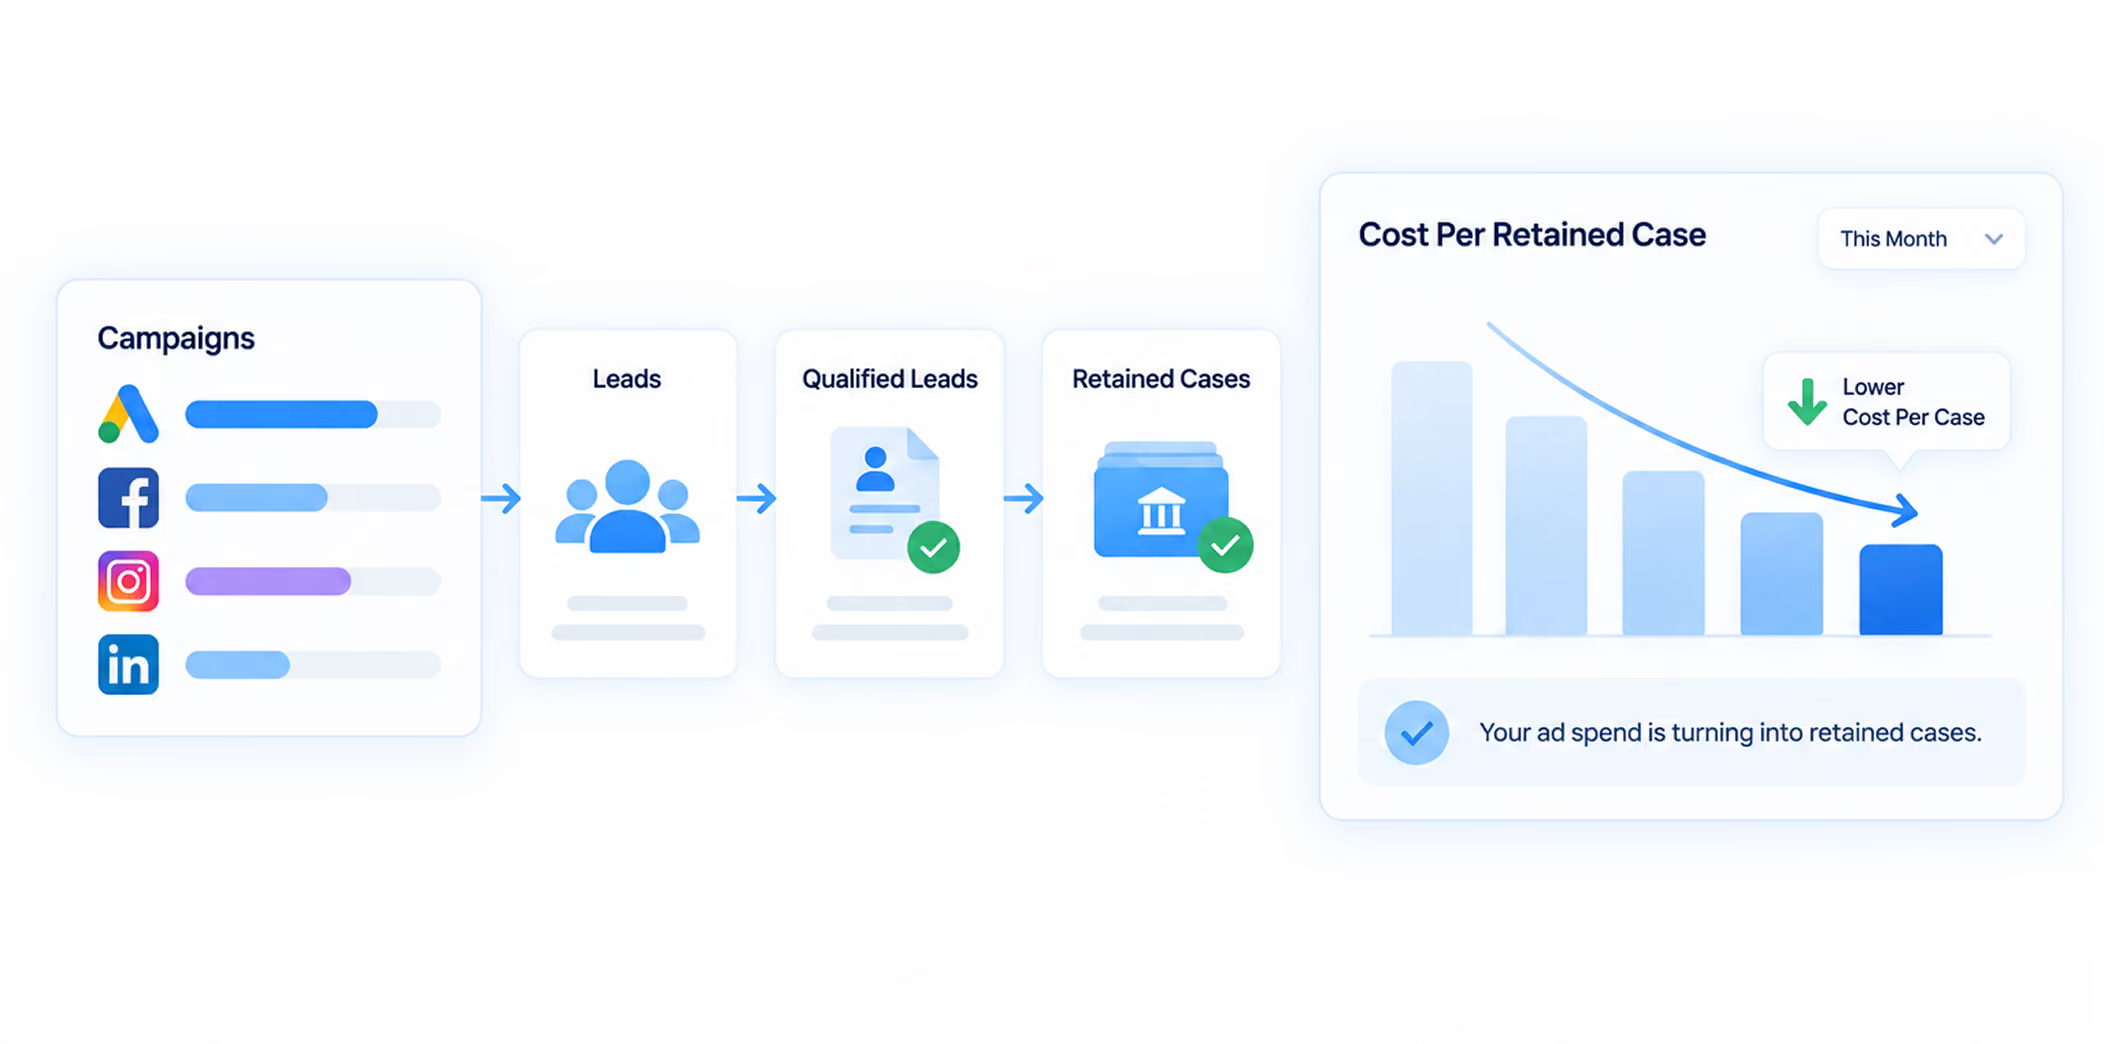
Flow diagram showing campaigns from Google Ads, Facebook, Instagram, and LinkedIn leading to leads, then qualified leads, then retained cases. A bar chart titled 'Cost Per Retained Case' shows a decreasing trend with a note indicating lower cost per case and a checkmark confirming that ad spend is turning into retained cases.

Cost Per Retained Case

Ad spend means nothing if it isn't converting. We track what each retained case actually costs, not just what campaigns generate.

Digital marketing funnel showing traffic sources from Google Ads, Facebook, Instagram, and LinkedIn feeding into a layered funnel representing audience segmentation, leading to organized data storage and an upward trending graph indicating growth or improved intake response time.

Lead-to-Case Conversion Rate

Firms that can't see the funnel can't fix it. We report where prospects drop off and why.
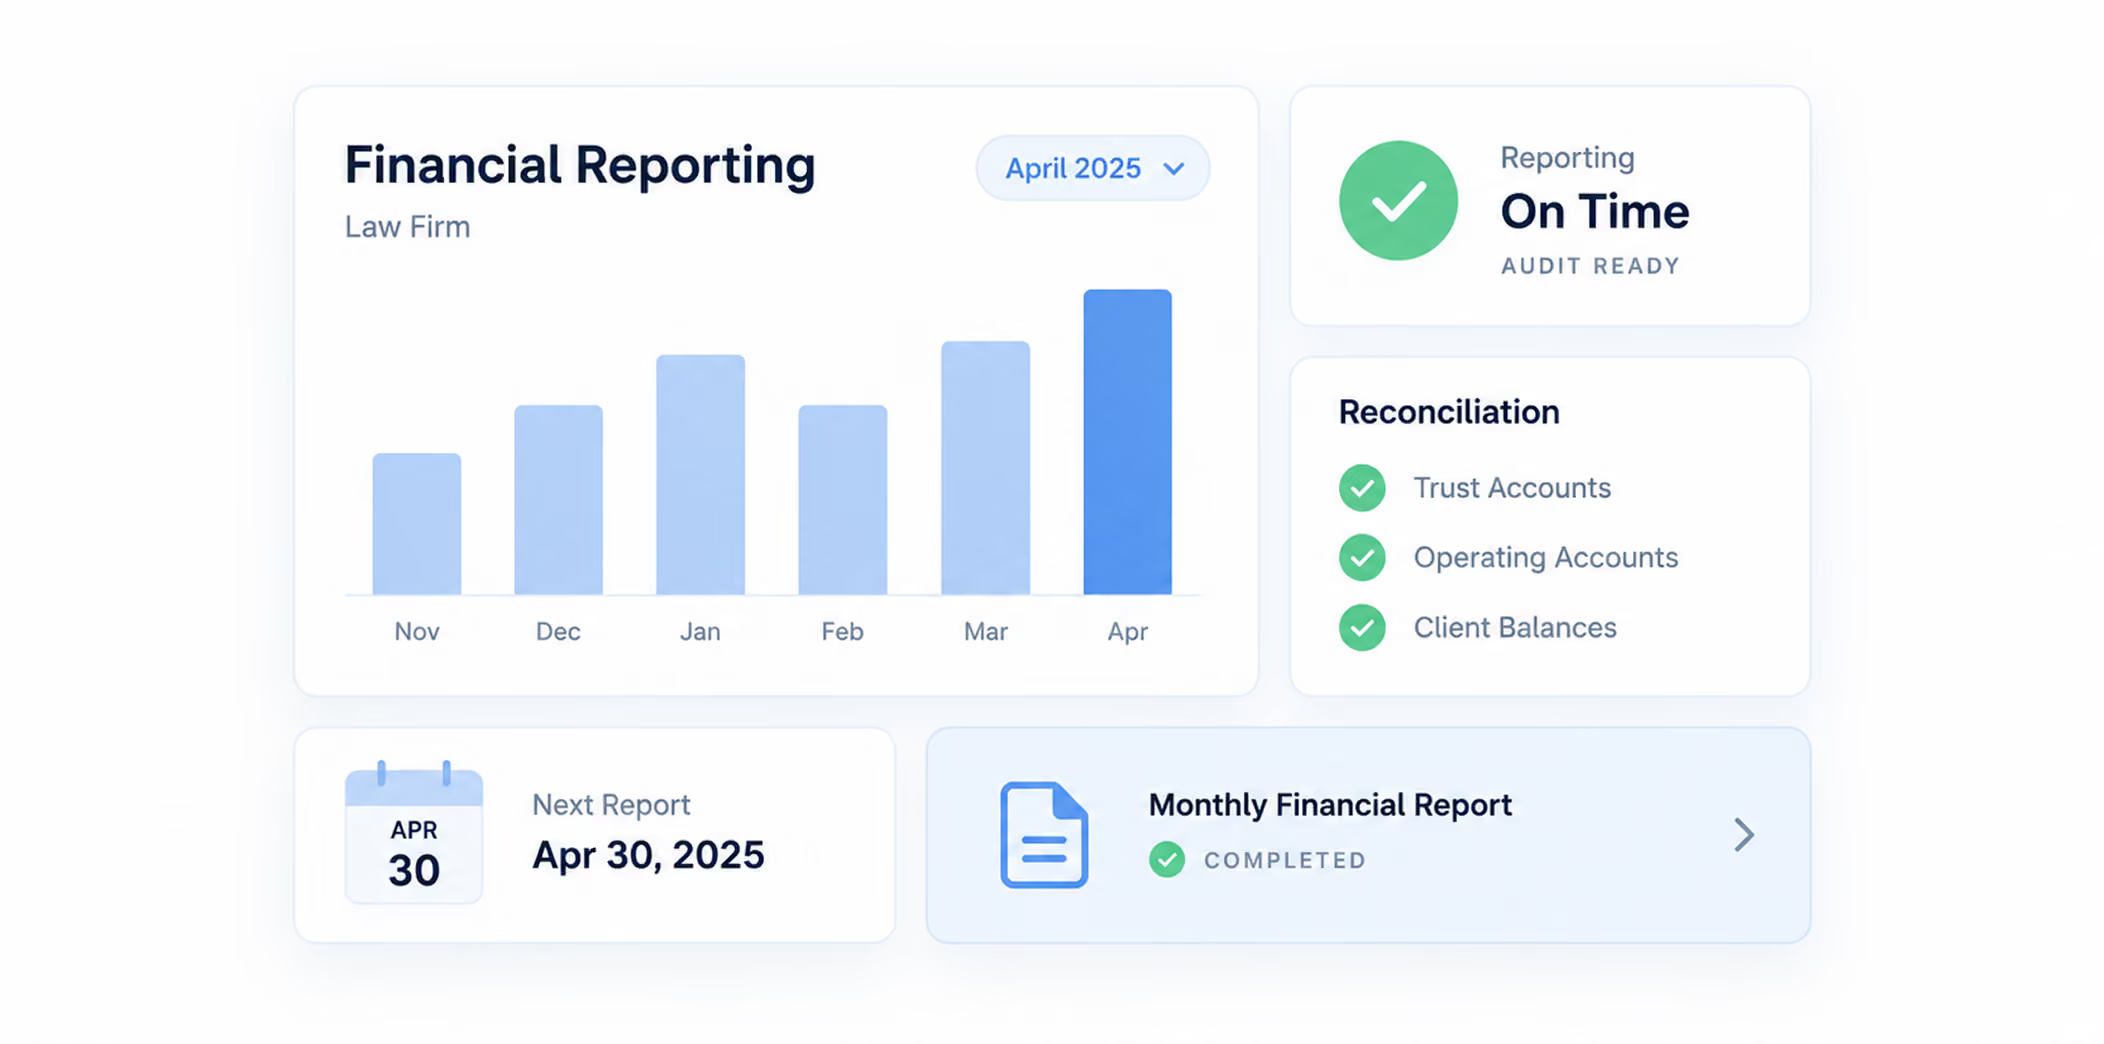
Financial reporting dashboard for a law firm showing a bar chart from November to April 2025 with an increasing trend, highlighting April as the highest. Indicators show reporting is on time and audit ready. Reconciliation checklist with completed trust accounts, operating accounts, and client balances. Next report date is April 30, 2025, with a completed monthly financial report confirmation.

On-Time Financial Reporting

Trust accounting errors put a firm's standing at risk. We deliver on-time finance and trust accounting reporting, so your books stay audit-ready.

Faq

FAQs about Managed Services for Law Firms

  • Does P360 replace our external marketing, IT, and bookkeeper? 

  • Can P360 help with trust accounting?

  • Does this work for a new or expanding firm, not just an established one? 

  • What does a Practice Growth Evaluation involve?